Dicamba Drift – Part 2

In Dicamba drift – Part 1, I described what the dicamba herbicide is, showed how it works, and provided resources about human health effects of dicamba. I also described how dicamba drift happened in 2016, 2017, and 2018. If you haven’t read Part 1 yet, go there first, then come back to Part 2. In this post, I have the timeline of how dicamba drift became a problem, and what may happen in 2019. In Part 3, I’ll discuss some of the specific issues associated with applying dicamba and what might be causing the drift. Part 4 wraps up the series by considering the response of the dicamba manufacturers and potential social impacts this whole debacle might have moving forward.

Dicamba drift picks up

It seems like dicamba drift was a sudden problem. In actuality, dicamba has always been a particular risk for drift. Dan Charles, agriculture correspondent at NPR, summed up dicamba’s problem potential this way: “Dicamba… is notorious for a couple of things: It vaporizes quickly and blows with the wind. And it’s especially toxic to soybeans, even at ridiculously low concentrations.” Dicamba’s volatility was described in 1979, and various formulations over the years have attempted to reduce the likelihood of the herbicide to evaporate at certain temperatures. Dicamba’s impacts on soybeans have also been known for decades, with extension agents recommending dicamba not be used near soybeans as early as 1971.
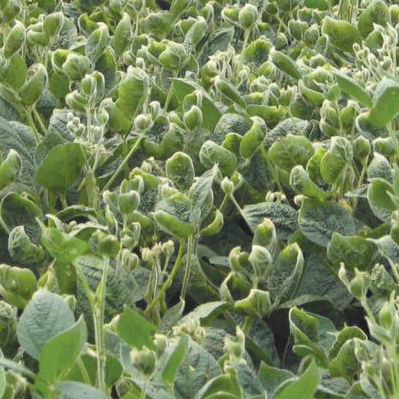
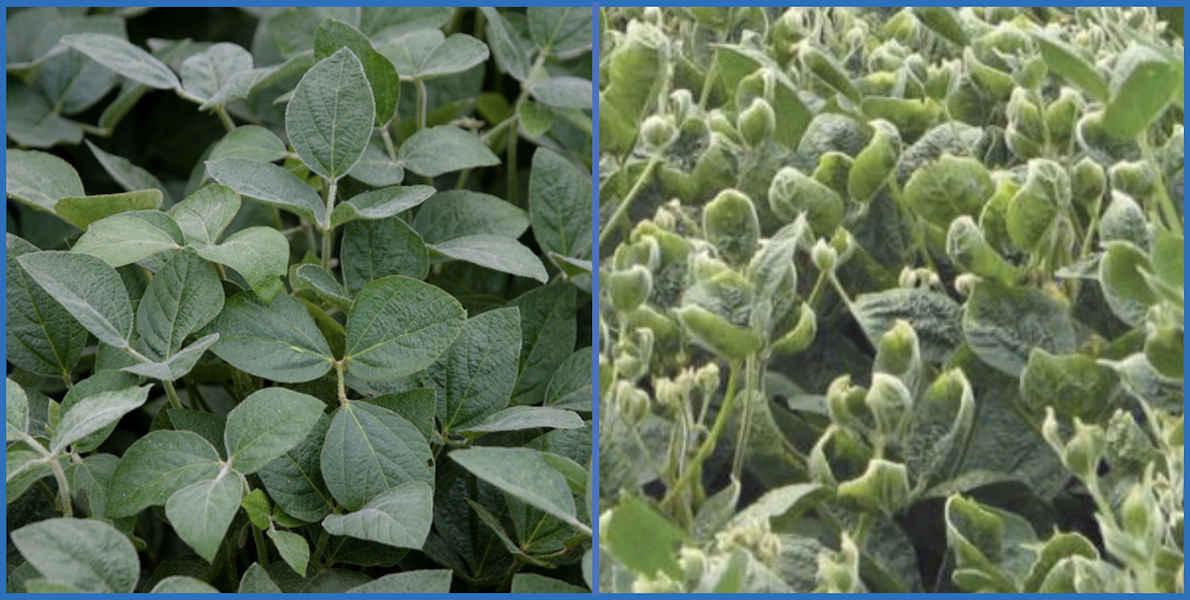
Many plant species show visible damage from small amounts of dicamba, particularly at early growth stages. Dicamba injury is particularly easy to see in soybean; it causes characteristic cupping of leaves, as shown in the image below. Despite its drawbacks, farmers used dicamba for many years without too much trouble. They didn’t use it very widely, mostly to treat weeds in corn. Farmers knew to avoid using dicamba near broadleaf crops during the growing season because of their high susceptibility to damage.
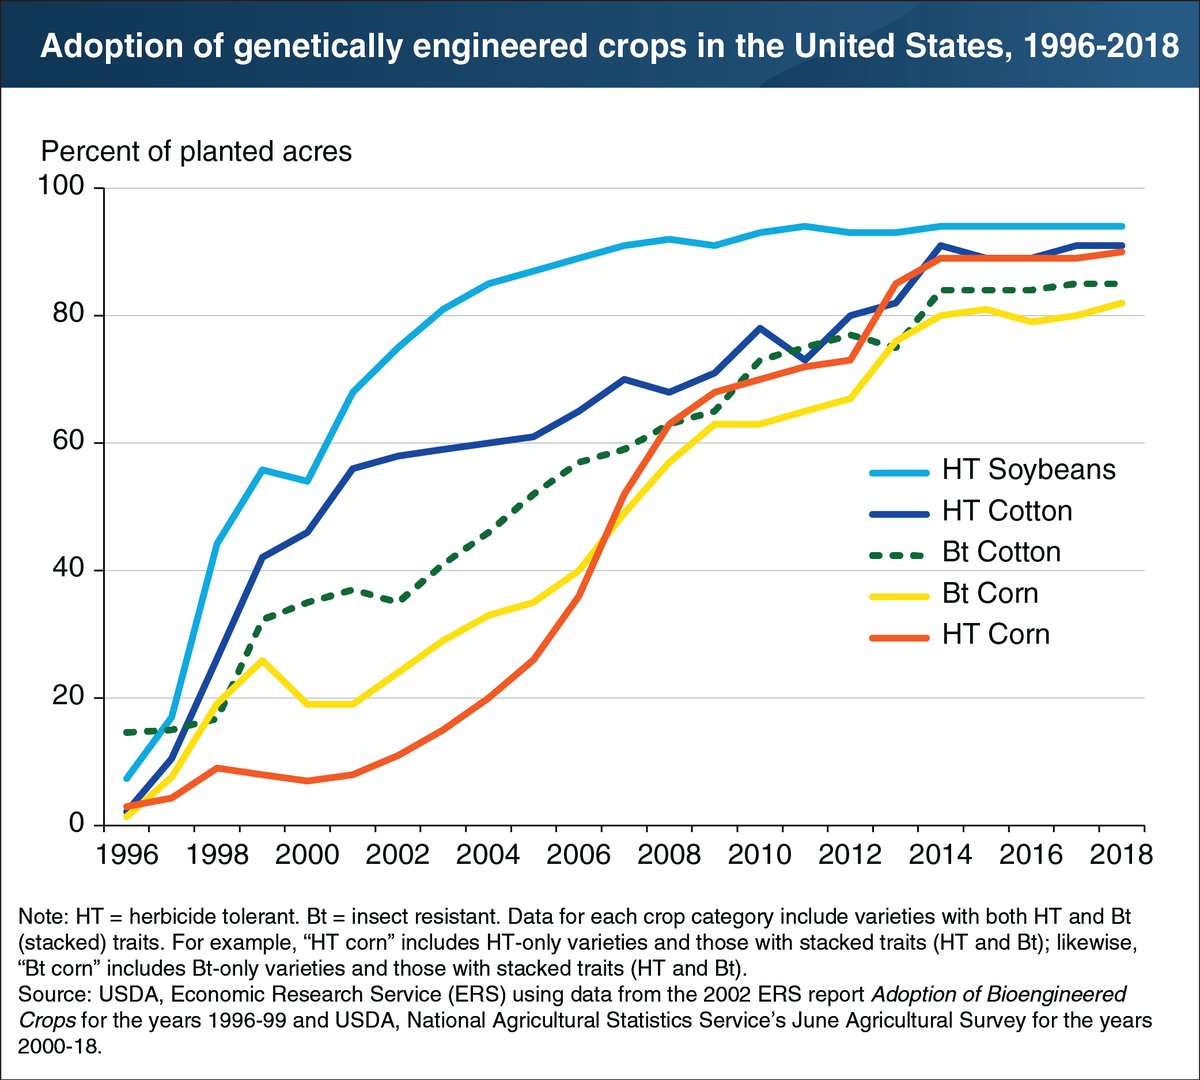
Something changed in January 2015: the USDA approved dicamba tolerant soybean and cotton. Monsanto had their elite genetics tied up with the dicamba tolerance trait, so they began selling seed right away. That meant farmers were already planting about 20 million acres of dicamba tolerant soybeans in the spring of 2016. Because the Coordinated Framework for the Regulation of Biotechnology keeps regulatory authorities separate, the USDA was able to approve the GE crops without considering what might happen with the associated herbicides.
EPA didn’t approve a lower volatility formulation of dicamba for use on these dicamba tolerant crops until November 2016. Specifically, the approved formulations are XtendiMax by Monsanto, FeXapan by DuPont, and Engenia by BASF. In the meantime, farmers who planted dicamba tolerant soybeans had some difficult choices. Many had glyphosate resistant weeds that could decrease yields. Not treating weeds before they produce seed could result in worse weed problems the following year. Farmers could use older dicamba formulations that were not labeled for use with the GE crops. That would solve their weed problems and protect the yields of their soybeans – but it would also be in violation of the law.
Some farmers did choose to break the law and applied dicamba off-label to their GE dicamba tolerant soybeans. Reports from extension agents in the early summer of 2016 showed that dicamba drift was a major problem, and that illegal application was the culprit. Farmers could be fined by states for illegal use, but the fines were too small to be a deterrent. Farmers can face prison time for such violations; one farmer may serve 20 years for illegal application of dicamba and lying about it to investigators.

dicamba drift injury soybean cupped leaves
Healthy soybean plants (left) have broad, flat leaves. Dicamba-injured soybeans (right) have cupped leaves. Healthy soybean image by United Soybean Board, injured soybean image by the University of Arkansas, both via Flickr.

The drift continues

In January 2017, four farm and environmental groups filed a lawsuit against the EPA. They argued that the dicamba registrations are illegal because EPA didn’t follow parts of the Endangered Species Act and the Federal Insecticide, Fungicide and Rodenticide Act. That case is still pending (in November 2018, Monsanto filed a motion to dismiss the case). If the judges rule the registrations are in fact illegal, then we might go back to dicamba tolerant seeds with no dicamba formulations that can be used with them.
With the new dicamba formulations available, you might think that lawsuit was a bit premature. The drift should decrease, and things should quiet down for dicamba, right? Unfortunately, that’s not what happened. In 2017, US farmers continued to plant GE dicamba tolerant soybeans in large numbers: 40 million acres, about half of the US soybean crop. Even though the correct formulation of dicamba was available, drift continued.
Kevin Bradley at the University of Missouri tallied all the reports for 2017. He found “2,708 dicamba-related injury cases currently under investigation by various state departments of agriculture around the US, and that there were approximately 3.6 million acres of soybean that were injured by off-site movement of dicamba at some point during 2017.” This may represent only a small fraction of the actual dicamba drift damage.
In October 2017, EPA implemented some changes to the pesticide labels in an effort to reduce the drift problems for 2018. A July 2018 estimate by Kevin Bradley found around 600 cases of injured soybeans making up about 1.1 million acres. This may be a decrease from 2017, but data stopped coming in after July. We don’t know the true extent of the 2018 damage.

What’s next for dicamba

With all the problems of 2016, 2017, and 2018 – what’s next for dicamba, and more importantly, what’s next for farmers and their neighbors? On Halloween 2018, the EPA announced changes to the dicamba pesticide registration, giving farmers a few short months to plan. States are scrambling to implement training for pesticide applicators on the updated pesticide labels. The EPA summarizes the changes:

EPA reached an agreement with manufacturers on measures to further minimize the potential for damage to neighboring crops from the use of over-the-top dicamba formulations used to control weeds in dicamba-tolerant cotton and soybeans. The [manufacturers] agreed to registration and labeling changes including making these products restricted-use, record keeping requirements, and certain additional spray drift mitigation measures for the 2018 growing season.

The EPA emphasizes that farmers may use only the new dicamba formulations on dicamba tolerant crops. Using other dicamba products for that purpose is a violation of the label, and the label is the law. As Dan Charles reports, “the [EPA’s] decision is likely to boost sales of dicamba-tolerant seeds next year. Some farmers, in fact, say that they’ll be forced to plant them. Otherwise, their crops could be damaged by dicamba fumes drifting in from neighboring fields.”
Planting dicamba tolerant seed might help some soybean and cotton farmers, but changes to the dicamba registration may not reduce damage to other crops, or to native vegetation. It also doesn’t help farmers who hoped to grow organic or non-GMO soybeans or cotton, or any crop besides dicamba tolerant soybean and cotton, or naturally tolerant grasses like corn.
Bob Hartzler at Iowa State University lists EPA’s changes in a post titled Moving Forward with Dicamba. Also see his initial thoughts on the new approach to dicamba management.

  1. People under the supervision of a certified applicator are no longer allowed to make applications.
  2. Applications are allowed only from 1 hour after sunrise to 2 hours before sunset (previously the restriction was between sunrise and sunset).
  3. Applications are restricted to 45 days after planting or prior to R1 stage of soybean, whichever comes first (previously the restriction was up to and including the R1 stage).
  4. Applications cannot be made if rain within 24 hours may result in soil runoff (previously the label stated not to apply if rain is expected to occur within 24 hours).
  5. The label clarifies what constitutes sensitive areas and where downwind buffers are required. The applicator must survey the area for sensitive crops and residential areas, and then not apply the product when wind is blowing towards these areas. It is up to the applicator to determine the appropriate distance between the target site and sensitive area. One of the more important changes is that the label states that managed or mowed areas adjacent to fields are now considered a non-sensitive area. Thus, the road right-of-way can be considered part of the 110 ft downwind buffer.
  6. There is a new restriction regarding buffers around the entire field in counties with endangered species.
  7. Dicamba specific training will again be required for all applicators using the registered products on dicamba-resistant soybean.

Dicamba Drift – Part 1

Herbicide tolerant crops have undoubtedly made weed control easier for farmers, and have resulted in a small but notable reduction in herbicide toxicity in US agriculture. Adoption rates in the US have been astoundingly high, with farmers in the US planting genetically engineered (GE) varieties for over 90% of corn, cotton, and soybean acres, as shown in this chart from the US Department of Agriculture (USDA).
Herbicide tolerance traits are often created with genetic engineering, such as the infamous Roundup Ready crops that are tolerant to glyphosate, but can also be developed with traditional breeding or mutagenesis, such as Clearfield wheat that is tolerant to imazamox. Herbicide tolerant crops have been in the news in part due to the newest version on the market – dicamba tolerant crops. Specifically, there have been problems with dicamba drift, meaning the herbicide hasn’t consistently stayed in the fields where it was sprayed.
herbicide tolerant crops adoption USDA

What is dicamba?

According to the Environmental Protection Agency (EPA), the US agency that regulates pesticides:

Dicamba “is a widely used herbicide on agricultural crops, fallow land, pastures, turfgrass, and rangeland. It was first registered in the US in 1967. Historically, most dicamba applications occurred in late winter or early spring for removal of broadleaf weeds prior to planting crops. It is registered for use in agriculture on corn, wheat, cotton, soybeans, and other crops.”

Dicamba is a growth regulator that acts like natural plant hormones called auxins. The herbicide 2,4-D is also a growth regulator. Plants need natural auxins to grow in a normal shape in response to external stimuli like light and gravity, as in the sped-up Arabidopsis plant below.
Dicamba is sold as Banvel, Clarity, DiFlexx, Engenia, XtendiMax, and other name brands. Dicamba selectively controls broadleaf weeds (such as dandelion and ragweed), but grasses (including crops like corn and rice) are naturally resistant.
When a plant has too much growth regulator, it grows in unexpected ways and eventually dies. This could happen if it has a mutation in auxin-related genes or if it is sprayed with dicamba, for example. The cells divide too fast in the wrong directions, and they don’t respond to external stimuli as they should. Since plant growth regulators act specifically on plants, the effects on animals (and humans) are limited.

Human health and dicamba

Dicamba is a relatively safe pesticide, when used as intended. For example, a large study of pesticide applicators by the National Institutes of Health found “did not find clear evidence for an association between dicamba exposure and cancer risk”, and a later examination of the same data set by Health Canada similarly found that dicamba was not “associated with a significant increase in overall cancer incidence.”
People and animals would need to consume large amounts of dicamba for there to be health effects, and dicamba is excreted quickly. “Dicamba is moderately toxic by ingestion and slightly toxic by inhalation or dermal exposure.” However, fish may be more susceptible to harm. A summary of human health impacts of dicamba can be found on the National Library of Medicine’s TOXNET, but keep in mind that 1) studies on isolated cells or in animals are not necessarily predictive of human health impacts and 2) some of the information provided is for other pesticides.
As is typical for pesticides, there may be impacts to human health and the environment due to inactive ingredients, such as surfactants. Pesticides should always be applied according to the label – such as with proper protective gear and away from waterways.

Dicamba is drifting

First, what is drift? Pesticides are formulated and labels instruct application in ways that keep the pesticide where it was applied. Still, drift is always a possibility when using any pesticide, on the farm or at home. As described by the National Pesticide Information Center:

Pesticide drift is the airborne movement of pesticides from an area of application to any unintended site. Drift can happen during pesticide application, when droplets or dust travel away from the target site. It can also happen after the application, when some chemicals become vapors that can move off-site. Pesticide drift can cause accidental exposure to people, animals, plants and property.

Drift often happens when there is an unexpected weather change during or shortly after pesticide application. Farmers generally follow pesticide labels (the Label is the Law) and use pesticides in a way that minimizes drift (drift = wasted pesticide = wasted money), so drift happens at a fairly constant, low level.
Dicamba has been in use since its registration in 1967. Farmers used dicamba with minimal incidents all the way up to 2016. Then, in 2016, 2017, and 2018, there were manymany incidents of reported dicamba drift onto non-tolerant crops, and the problem is likely much larger than reported. In Nebraska for example, a survey of farmers found that 51% of respondents had dicamba injury on non-dicamba tolerant soybean, but only 7% of those filed an official complaint with the Nebraska Department of Agriculture.
The damage isn’t just to soybean. Drift from dicamba is impacting wild plants, too. Beekeepers in some areas have reported that dicamba reduced pollen and nectar sources for their bees. Dicamba has also caused damage to small farmers growing speciality crops and to homeowner’s landscaping. People may not report damage because they want to stay friendly with neighbors. But drift keeps happening, harming relationships in addition to the plants, including one dicamba-motivated murder.
The financial damage to soybean at least may be limited. A recent meta-analysis looked at soybean response to dicamba drift and found that while visible damage could be caused by very low amounts of dicamba, visible damage isn’t necessarily an indicator of yield loss. Dicamba injury is easy to see in soybean; it causes characteristic cupping of leaves, as shown in the image below.
When there is financial damage, farmers have a few options. Initially, crop insurance did not cover dicamba drift, but rules have changed: farmers should check with their insurance agent immediately upon discovering damage. Farmers might use liability insurance to help recover losses, but insurance companies will not cover off-label (illegal) applications. Neighbors also have the option of negotiating with each other out of court, or can pursue a civil lawsuit, all typical options for chemical trespass. Of course, the first step is to document the damage.

soybean leaves affected by dicamba drift
Healthy soybean plants (left) have broad, flat leaves. Soybeans injured by dicamba drift (right) have characteristic cupped leaves. Healthy soybean image by United Soybean Board, injured soybean image by the University of Arkansas, both via Flickr.

Why is dicamba drifting more since 2016 compared to previous years? Coincidentally, the USDA approved dicamba tolerant soybean and cotton in 2015, and farmers began planting in 2016. The story is far more complicated than that, though.
For a timeline of how dicamba drift became a problem starting in 2015 through 2018, and for a preview of what might happen in 2019, see Dicamba Drift – Part 2. In Part 3, I’ll discuss some of the specific issues associated with applying dicamba and what might be contributing to drift. Part 4 wraps up the series by considering the response of the dicamba manufacturers and potential social impacts this whole debacle might have moving forward.

Advisory committees for biotech

The White House, by Matt Wade via Wikimedia Commons.

What creative ideas do you have for the US biotechnology regulatory agencies? With the White House call for comments closing on November 13th, now is the opportunity to share. In this post, I’ll talk about one idea that will be in Biology Fortified’s comment – feel free to take it and run with it!
We’ve made it easy for everyone to provide comments to the White House, and you can learn more at our post: You can improve US biotechnology regulation
There are tons of advisory committees across the US government. Why isn’t there one (or more) for biotechnology regulation? Let’s take a look at just a few advisory committees and see what they do. Continue reading “Advisory committees for biotech”

Off-patent GMO soybeans: What happens now?

Soybean Seed
Farmers can save these Roundup Ready seeds

The development, testing, and regulation of genetically engineered crops usually takes a significant investment of time and resources, and it comes as no surprise that these crops are patented so that their developers can recoup their investments. Farmers who grow these crops usually pay licensing fees for the use of the technology, and sign license agreements that restrict their ability to save the seeds. Now, a variety of GMO herbicide-tolerant soybeans has been released by the University of Arkansas with no technology fees, and no license agreements to sign. The farmers are free to save the seeds and replant them ad infinitum. This is possible because the patent for the first genetically engineered trait in soybeans – Roundup Ready – has expired. The world of “generic” or Open Source GMOs is upon us, however, there are still some practical challenges ahead.
The University of Arkansas tells the story of this new variety.

The University of Arkansas System Division of Agriculture has released its first soybean variety that features Roundup Ready® technology.
Division soybean breeder Pengyin Chen said the new variety, called UA 5414RR, offers the weed control advantages of Roundup Ready® soybeans without the added cost of technology fees. He said growers could also save seed from each harvest for planting the following year.
Monsanto’s patent on the first generation of Roundup Ready® products expires in March 2015, Chen said, and the company shared the breeding material with public breeding programs, including the Arkansas program directed by Chen. He said UA 5414RR fills a niche for growers who want to use the Roundup system of weed control but don’t want to pay the higher cost of the next generation Roundup Ready 2 Yield® technology.

Continue reading “Off-patent GMO soybeans: What happens now?”

How To Do GMO Food Labeling Right

Written by Steve Savage

Shopping, from Anthony Albright.

A Modest Proposal

Should food with ingredients from genetically engineered crops – “GMOs” – be labeled?  Many argue that consumers have a “right to know” about this.  Ok, if the real reason for labeling is to provide consumers with knowledge, then the label should read:
“Contains ingredients from biotech enhanced crops approved by the USDA, FDA and EPA”
That would tell people what is unique about these crops.  Humans have been genetically modifying crops for centuries using a variety of methods.  The difference for genetically engineered crops is that they must be fully characterized and tested in order to gain approval from three different regulatory agencies – the USDA, the EPA and the FDA (there is a description of this process below if you are interested).  Crops modified in other ways including those generated by conventional breedingmutation breeding or “wide crosses” or hybrids or doubled haploids don’t have to be tested or approved at all.  The clear, international scientific consensus is that genetic engineering involves no unusual risk relative to all the other methods of genetic modification, but this testing was instituted out of an abundance of caution.  Thus, any label should let consumers know about this extra level of scrutiny conducted for their benefit. Continue reading “How To Do GMO Food Labeling Right”

Get the scoop on GMO wheat in Oregon

Frank wants to learn more about wheat.

Most Biofortified Blog readers will have heard by now that glyphosate tolerant genetically engineered wheat has been found growing in a field in Oregon. There’s a lot of interesting details to consider, but for now we’ll start with a simple list of links to help you find reliable information as this story develops.
First, let’s look at some general information about regulation of agricultural biotechnology in the US. There are three agencies that cover different aspects:

Continue reading “Get the scoop on GMO wheat in Oregon”

How Wrong Is The Latest “Dirty Dozen List?”

Written by Steve Savage

Peppers produce a variety of natural pesticides, including capsaicin. Peppers by James Walsh via Flickr.

The Environmental Working Group (EWG) says that it “helps protect your family from pesticides.” The purpose of this post is to “help protect your family from dangerously misleading information from the EWG.”
Each year since 1991, the USDA has been publishing the results from a large-scale pesticide residue monitoring program called the Pesticide Data Program (PDP). Each year, a different set of crops is chosen and samples are purchased from regular stores and tested. Year after year, the results of those studies confirm the safety of the food supply. Year after year the EWG misrepresents the data to say otherwise. To understand what that is like for the people who farm those crops, consider this analogy:
Imagine that you are taking a college course that is critical for your graduation, but your entire grade is based on the performance of thousands of other students you don’t even know and with whom you can not communicate. Some of those students’ test results will be chosen at random and the grade for everyone in the class will depend on how they did. When the grading is done, you find out that the class score was over 99%: A+!  Then, someone who doesn’t really understand the topic of the class, or chooses not to,  re-grades the test and tells your potential future employers that you got a D, and many of them believe the incorrect grade. Continue reading “How Wrong Is The Latest “Dirty Dozen List?””

Misuse Of A Vietnam Era Tragedy

Written by Steve Savage

Mark Twain once said, “A lie can travel half way around the world while the truth is putting on its shoes.”  There was a perfect example of that last month.  The Center for Food Safety (CFS) spread the term, “Agent Orange Corn” for Dow AgroSciences’ new biotech corn hybrids that are working their way through the regulatory process.   These hybrids have been modified to be more resistant to 2,4-D, an herbicide that was introduced in 1948.  This is being cast as a return to the use of Agent Orange and that is completely untrue.  There is a lot of interesting detail behind this, but the CFS moniker for the corn is a classic case of information twisting – twisting in a way that is intentionally misleading.  The reason that the term “Agent Orange Corn” is inaccurate can be discovered in a 1-minute Wikipedia search, but this did not prevent a host of of bloggers, environmental and Organic organizations, and even “news outlets” from uncritically passing along the disinformation. Continue reading “Misuse Of A Vietnam Era Tragedy”

Details on the Dirty Dozen

EWG Shopper's Guide to Pesticides Dirty Dozen Clean Fifteen

As you may already know, the Environmental Working Group is a 501(c)(3) NGO with the goal of protecting “kids from toxic chemicals in our food, water, air and the products we use every day”. One of their major efforts is the yearly Shopper’s Guide to Pesticides™.

EWG Shopper's Guide to Pesticides Dirty Dozen Clean Fifteen

EWG gives many many reasons why they think you should use the guide, specifying that you (the consumer) should eat organic or at least choose the Clean 15™ over the  Dirty Dozen™:

The 12 most contaminated fruits and vegetables (the “Dirty Dozen”) are contaminated with an average of 10 different pesticides, with many tainting more than one type of produce. In contrast, the “Clean 15,” the 15 least contaminated fruits and vegetables, contain an average of less than 2. Eating organic food lowers pesticide body burdens as well. Research shows that concentrations of pesticides in children’s bodies peak during seasons that they eat the most produce, but fall to below detectable levels in just 5 days when they eat organic food.

The list of reasons has a lot of scary facts about how many pesticides detected on food, just how “polluted” our bodies are from the things we eat, and explains how our government barely regulates pesticides. Near the bottom, EWG lets us know that despite the scary facts that the need to eat fresh produce outweighs any risk from pesticide residues. They also remind consumers of the importance of eating fresh produce on their FAQ page. They forget to mention that even the “dirty” produce is safe to eat.

Unfortunately, I’m not sure if anyone gets to that part, considering that media coverage of the Shopper’s Guide rarely mentions it, instead focusing on the scary facts (as in ‘Dirty dozen’ produce carries more pesticide residue, group says on CNN Health, which dismisses the silly government for thinking that small amounts of pesticides won’t hurt us).

The truth is, pesticides are scary. As EWG’s Amy Rosenthal says, “Pesticides are designed to kill things.”

The devil, as always, is in the details.

We need the EWG

Before we get into those details, I’d like to say a few things about the Environmental Working Group in general, or really any group that does what EWG tries to do. EWG has the ability to provide a very important benefit to society. Government spending on science has decreased over the years, leaving most toxicity research to the companies that make the products being tested.

Until we follow the leadership of India and develop a network of government certified independent testing labs, we’re all kind of left with less information than I’d prefer for many products we use every day. It’s not that I think every corporation is driven by people who choose profits over safety (on the contrary, they have to at least think their products are safe or suffer bad press or worse if people get sick) but results of corporate-funded tests are often not made available to the public which leaves regulators with less info than they need to make good science-based decisions.

Our system works fairly well (the grand majority of people get through life without health problems caused by things they can’t control other than their own genetics*) but it could always be better. EWG works to get information to regulators and presents a non-industry point of view, which is much needed. Unfortunately, despite their outwardly awesome intentions, some of the results are less than awesome.

Details, details

danger sign with elephant on it
Danger, elephants. Taken by Adam Foster at Knowsley Safari Park in England via Flickr.

In the materials accompanying the Shopper’s Guide, there are two details that are never discussed.

The first elephant in the room is dose. For any compound, from water to arsenic to ricin to organophosphates, there are amounts that are safe and amounts that are hazardous. There are amounts that will cause acute (immediate) reactions and amounts that will cause chronic problems after long term exposure. Are the amounts of pesticides found on produce enough to cause acute or chronic health problems? The EWG list does consider amount, but does not compare the amounts to EPA guidelines. The accompanying materials focus on the number of pesticides, not the dose.

The second elephant is the type of pesticides that were found on produce. There isn’t any weighting in the Shopper’s Guide of individual pesticides based on relative toxicity. This could be a problem because not all pesticides are created equal. Organophosphates, for example, are extremely dangerous because they affect cholinesterase, an enzyme that is essential for the human nervous system. Glyphosate, on the other hand, affects EPSPS, an enzyme that is only found in plants so human toxicity is low (surfactants and other ingredients in glyphosate containing herbicides may be dangerous in their own right, but EWG to my knowledge isn’t talking about those types of ingredients).

Careful consideration of dose and toxicity of pesticides on produce may mean a reordering of the list is necessary in order to truly keep consumers safe. It may also mean that many of the scary facts need some sober facts alongside to help us keep things in perspective. Let’s look at the  methods that EWG used to make the list and at the original USDA data.

EWG’s Methods

I have to tip my hat to EWG for providing their methods on their website. I don’t know how many people look at it, but I certainly did! They provide justifications for not discussing dose or type of pesticide:

The goal is to include a range of different measures of pesticide contamination to account for uncertainties in the science. All categories were treated equally; for example, a pesticide linked to cancer is counted the same as a pesticide linked to brain and nervous system toxicity, and the likelihood of eating multiple pesticides on a single food is given the same weight as the amounts of the pesticide detected or the percent of the crop on which pesticides were found.

The problem is that, as strange as it may sound, there are safe amounts of pesticides. With the incredibly low detection limits that advanced methods provide us, we can expect many positive results that aren’t biologically significant. This is why the EPA bothers to determine tolerance limits for each pesticide (see below: The Data). The EWG continues:

The EWG’s Shopper’s Guide is not built on a complex assessment of pesticide risks but instead reflects the overall pesticide loads of common fruits and vegetables. This approach best captures the uncertainties of the risks of pesticide exposure and gives shoppers confidence that when they follow the guide they are buying foods with consistently lower overall levels of pesticide contamination.

In other words, science-based risk assessment is bad because it’s complex? A less complex and unscientific method gives consumers more confidence than a science-based method? Perhaps, but this explanation of the method is a little too close to fibbing for my taste. Maybe we need to look deeper.
EWG looked at contamination in 6 different ways:

  • “Percent of samples tested with detectable pesticides.” Assuming that the data was used properly, this is a good metric. It tells us how many of all the samples within a category had pesticide residues.
  • “Percent of samples with two or more pesticides.” This metric might be useful if we are concerned about potential effects of consuming more than one pesticide.
  • “Average number of pesticides found on a single sample.” This isn’t as useful as a median number of pesticides could be. If most of the samples contain 0 pesticides, the average would be lower than the median. If only one of the samples contains a very large number of pesticides, the average would be artificially high.
  • “Average amount (level in parts per million) of all pesticides found.” Here’s where the science gets thrown out. The type of pesticide isn’t considered even though we know that some pesticides are dangerous at low doses while other pesticides are safe at much higher doses. The ppm of different pesticides should not be averaged unless they have similar toxic doses. No where on the Shopper’s Guide site  is there a discussion of how the pesticide levels found in produce match up to EPA guidelines, or how those guidelines are created (in most cases the guidelines from the EPA are at least 10 times lower than the actual dangerous dose).
  • “Maximum number of pesticides found on a single sample.” This isn’t very useful either. Perhaps one sample was grown by a particularly zealous farmer who used more pesticides than she should. Perhaps the single sample was accidentally contaminated. Should the entire category of produce be condemned because of this single sample, out of hundreds of samples? Using the median number of pesticides for all of the samples make much more sense.
  • “Total number of pesticides found on the commodity.” Again, this number could be based on one or a few samples which are not representative of all of the samples.

The Data

drop of dye into a glass of water
High speed capture of dye droplets by Derek Purdy via Flickr.

Since 1991, the Agricultural Marketing Service (part of the USDA) has collected data on pesticide residues in food as part of the Pesticide Data Program (PDP) using pretty rigorous methods (pdf). In addition to this testing, the FDA tests domestic and imported food to ensure that pesticide residues are below the tolerance levels (FDA probably doesn’t test enough samples due to funding cuts but that’s another post). 

The results are compared to tolerance levels (maximum pesticide residue limits) that are set by the EPA (you can find the tolerance for each crop/pesticide/country combo at Maximum Residue Levels database). According to the Latest PDP Findings of Interest to Consumers (pdf), “the vast majority of samples tested are well below the tolerance levels”. Specifically:

PDP tests high consumption foods using highly sensitive instruments to detect pesticide residues as low as 0.001 ppm, which is considered trace levels of residues. Residues detected in foods tested by PDP are reported in a great majority of samples below 1 part per million (ppm).

The USDA provides some comparisons to help us understand what 1 part per million is: 1 ounce of salt in a mountain of 62,500 pounds of sugar or 1 ounce of dye in 7,350 gallons of water.

The most recent Annual Summary of the PDP (pdf) contains data that was collected in 2008 and was released in December 2009. The Executive Summary tells us that 11,960 samples were analyzed, including fresh and processed fruit and vegetables (9,028 and 1,354 samples respectively), almonds, honey, corn, and rice (municipal drinking water is also tested). The positive pesticide residue detections were combined by food type; on average 1.6% of samples had positive residue detections. For fresh produce, positive samples ranged from 0 to 3.3% with an average of 1.9%. They go on to say:

For samples containing residues, the vast majority of the detections were well below established tolerances and/or action levels. Before allowing the use of a pesticide on food crops, EPA sets a tolerance, or maximum residue limit, which is the amount of pesticide residue allowed to remain in or on each treated food commodity. Established tolerances are listed in the Code of Federal Regulations, Title 40, Part 180. In setting the tolerance, EPA must make a safety finding that the pesticide can be used with “reasonable certainty of no harm” and that residues at (or below) the tolerance are safe. The reporting of residues present at levels below the established tolerance serves to ensure and verify the safety of the Nation’s food supply.

To restate, the methods used to detect pesticides are very sensitive, but a positive sample does not indicate a problem unless the detected level is above the established tolerance level. “A tolerance violation occurs when a residue is found that exceeds the tolerance level or when a residue is found for which there is no established tolerance.”

There were 60 samples that exceeded tolerance levels, making up 0.5% of all the samples (58 with 1 residue exceeding the tolerance and 2 with 2). There were 442 samples that had pesticide residues that don’t have established tolerance levels, making up 3.7% of all the samples (one reason why there isn’t an established tolerance level is that the pesticide in question isn’t labeled for use on the specific crop being tested). “In most cases, these residues were detected at very low levels and some residues may have resulted from spray drift or crop rotations.”

Starting on page 51 of 202, the results are presented in a table the includes the number of samples tested, the number of positive samples by pesticide type, the amount of pesticide detected, and the EPA tolerance for that pesticide. I encourage you to see the report for all the details. The data can be downloaded from the Agriculture Marketing Service.

Peaches

There do seem to be some discrepancies between what EWG says the USDA data says and what the USDA data says.

The EWG says “more than 96 percent of peaches tested positive for pesticides”, and “peaches had been treated with more pesticides than any other produce, registering combinations of up to 67 different chemicals.” That sounds pretty bad.

Table 3 of the 2008 USDA report lists the “Number of Samples Analyzed and Summary of Results per Commodity” (page 34). According to this table, 616 peach samples were analyzed, with an average number of 130 different analyses conducted on each individual sample, resulting in a total of 80,184 tests done on the 616 peach samples. Of these tests, 2,155 were positive for pesticide residues, and 52 different pesticides were detected. While the number of positive detections out of all the tests isn’t the same as the number of positive samples out of all the samples, it is still interesting to know that only 2.7% of all the tests conducted on peaches were positive.
52 isn’t 67. 2.7% isn’t 96%. What’s happening here?

EWG didn’t use the most recent data. Instead, they seem to have combined data from 2000 to 2008. That seems very strange to me, considering that EPA regulations for allowed pesticide use and allowed pesticide tolerances have been changing over the years, becoming more strict. At least they didn’t include pre-2000 data, but still this isn’t the best way to find the information that consumers want. We need to know how many fruits and vegetables today are positive for pesticides, not all the fruits and vegetables in the past decade.

Even when we consider the fact that the EWG isn’t working with the best dataset, that still doesn’t answer how they decided that more than 96% of peaches were positive for pesticides. Hopefully the answer will be clear once I’ve looked at the USDA data myself.

If not scary “facts”, then what?

I am definitely an advocate of using science-based approaches to farming that reduce input use overall, and of careful Integrated Pest Management strategies that use the safest possible solutions to any pest problem, only using inputs if other options have been unsuccessful, and using the safest possible pesticide whether that pesticide is natural or synthetic.

How do we encourage the government to introduce regulation that will make this happen and how do we encourage consumers to care about this enough to talk to their elected officials?

The best course of action would be to present the information in a less agenda driven way. Provide the data along with the EPA guidelines, which would show that the great majority of produce is well within guidelines. There are ways to advocate for reduced pesticide use without alarming people unnecessarily.
.
* In the developed world, health problems caused by our own choices (bad nutrition, lack of exercise, smoking, and so on) dwarfs any problems that might be caused by normal use of household chemicals, plastics, foods, etc.

Note: A group called Alliance for Food and Farming, called an “industry front group” by EWG has challenged the Shopper’s Guide, saying that it unnecessarily alarms consumers. I have not read any materials from AFF on this subject prior to writing this post to be sure that my comments were not based even subconsciously on their comments. I heard about the AFF response through the Iowa State Sustainable Agriculture Listserv, which led me to write a few responses about the Shopper’s Guide to the original poster which then were turned into this post. This year’s Shopper’s Guide came out in June 2010.