Part 6: Methylation Analysis

epigenetic ineheritance

By Alma Laney and Alison Bernstein

This post is the sixth in a series about transgenerational inheritance, epigenetics, and glyphosate that address questions raised by the publication of the paper, Assessment of Glyphosate Induced Epigenetic Transgenerational Inheritance of Pathologies and Sperm Epimutations: Generational Toxicology.

Are there problems with the methylation analysis?

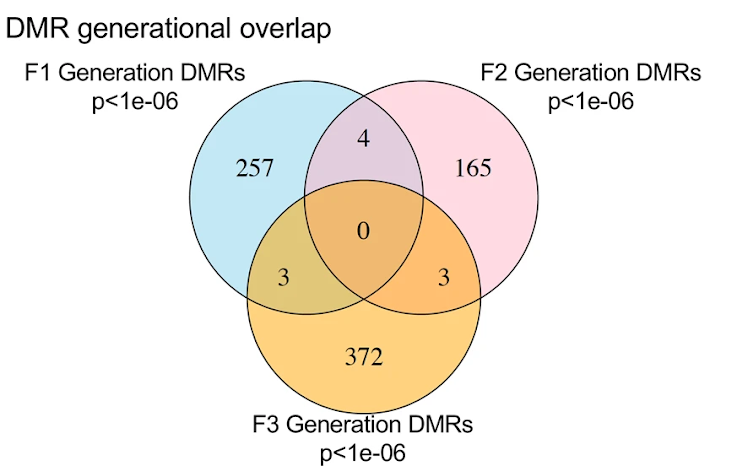
When this paper was published, there was much ado on Twitter about the Venn diagram in Figure 3 and the lack of overlapping differential DNA methylation regions (DMRs) from generation to generation. These criticisms were only partially valid. An important point to remember when considering varied effects on different generations, the exposure for parents (P0 generation), children (F1 generation) and grandchildren (F2 generation) are all very different exposure routes and doses, so we would not necessarily expect to see similar epigenetic outcomes in these generations. Where we might expect to see similarities in epigenetic regulation, if transgenerational epigenetic inheritance is occurring, is from grandchildren (F2 generation) to great-grandchildren (F3 generation).

methylation analysis
https://www.nature.com/articles/s41598-019-42860-0/figures/3

The lack of overlap between F1 and F2 makes biological sense. F1 is directly exposed in utero, while F2 is exposed as germ cells prior to fertilization and development. There are different exposures and there is no reason to assume that they will necessarily produce similar patterns of epigenetic changes. However, if the authors are concluding transgenerational epigenetic inheritance, the overlap between F2 and F3 is important.

The limited overlap here is consistent with the idea that only a limited proportion of the genome is available for transgenerational inheritance given that most of the genome undergoes a second wave of demethylation. Here, there are 3 identified DMRs showing transgenerational inheritance. Is this low? Is this high? We don’t really have a frame of reference to know. What we do know is that this small number of overlapping DMRs is fairly consistent with studies from this lab and others that have looked at transgenerational epigenetic inheritance. Characterization of these 3 DMRs as potential mediators of possible transgenerational inheritance seems to be the most intriguing finding here, but there is little to no exploration where these 3 DMRs are located and what they might be doing.

Given that there are only 3 potential loci for transgenerational inheritance, it would have been nice to see a biological confirmation to show that these are not 3 false positives (which is still possible even after applying the false discovery rate cutoff as they did).  An examination of whether these are hyper- or hypo-methylated in F2 vs F2 would also have been useful and typical information to provide. Finally, a discussion of their potential biological role based on what genomic regions would be more interesting and informative than that data provided.

Technically, their methods for methylation analysis are standard. MeDIP-Seq is a commonly used method and the bioinformatic tools they used are appropriate. However, it’s unclear if they have adequate statistical power and given the phenotypic heterogeneity and it’s also unclear what effect the pooling of sperm from multiple animals would have on the outcomes.

In addition, the figures they have chosen to present the data are not very informative.

  • In Figure 3, it is standard to report a table of the number of DMRs identified. Figure 3D is the infamous Venn diagram of Twitter fame that we discussed above.
  • Figure 4 tells us very little except that DMRs are located across all chromosomes as expected, but there is really no useful information to be gleaned from these figures.
  • Figure 5a is a permutation analysis which can be used in tests for differential methylation patterns across multiple generations to confirm that these DMRs are real, but the specifics of this analysis are not reported in the methods and we did not find the script provided with all the other scripts.
  • Figure 5b includes the PCA analysis for F3 discussed earlier. The text for this figure states that the PCA for DMSO controls and PBS controls in both the F1 and F2 generations are similar, but, as shown above, when one actually looks at those, it’s not clear that they really are similar.
methylation analysis
  • Figure 6 shows a very high-level gene ontology analysis, which is a way to begin to understand what functions might be affected in a given set of genes. Gene ontology is only the first step of exploring methylation results and is not very informative, partly because the gene ontology terms listed in Figure 6a are too high level.

Not following up on the 3 DMRs that are potential candidates for actual transgenerational epigenetic inheritance seems like a missed opportunity. Overall, this seems to be a cursory and incomplete analysis of the very extensive characterization of DNA methylation that they did.


View the other parts of our series on transgenerational epigenetic inheritance:

Part 5: Statistics

epigenetic ineheritance

By Alma Laney and Alison Bernstein

This post is the fifth in a series about transgenerational inheritance, epigenetics, and glyphosate that address questions raised by the publication of the paper, Assessment of Glyphosate Induced Epigenetic Transgenerational Inheritance of Pathologies and Sperm Epimutations: Generational Toxicology.

Statistics

In this paper, the researchers used a Student’s t-test to test the effects of glyphosate exposure on the biological measures that were taken in the experiment. Student’s t-tests are used to compare the means of two groups and should only be used with datasets that have a normal distribution. A normal distribution of data has a bell curve-shape with most data points being at the median.

Photo caption from Wikimedia Commons: “For the normal distribution, the values less than one standard deviation away from the mean account for 68.27% of the set; while two standard deviations from the mean account for 95.45%; and three standard deviations account for 99.73%.” Photo credit: Dan Kernler via Wikimedia Commons and used under CC BY-SA 4.0 with no alterations.

Are the data normally distributed?

The authors do not mention in the manuscript if they tested for normality in this specific dataset, but they cite a previous paper from their groups that states that normality was confirmed for these outcome measures. However, no mention was made of what tests were used and what those results were in either paper. Thus, as readers, we cannot verify that the data is normally distributed due to the incomplete reporting of methods and results.

It is generally recommended to state the name of all statistical tests used in the methods and provide information about the results of these tests, although these details are often omitted from publications. A t-test can tolerate some deviation from a normal distribution, but if the data violate the assumption of normal distribution greatly, there are alternate non-parametric statistical tests for a two-group comparison that would be appropriate.

Is a t-test or non-parametric alternative appropriate for this study design?

The bigger issue with a t-test in this scenario is not whether the data is normally distributed or not, but instead is that given the lack of control for all the other potential sources of variation (genetics, litter effects, breeding effects, etc) is a simple two-group test appropriate?

Because the experimental design did not adequately account for these other sources of variation, a mixed-effects model of analysis would be more appropriate here. A t-test would only be appropriate if all the other variables were controlled for or were demonstrated to not affect the outcome. Even in a well-designed transgenerational experiment, this would be difficult so a mixed-effects model would be strongly preferred. A mixed-effects model would allow researchers to control for issues such as litter size and cage effects if they were not controlled for experimentally.


View the other parts of our series on transgenerational epigenetic inheritance:

Part 4: The problem of founder effects

epigenetic ineheritance

By Alma Laney and Alison Bernstein

This post is the fourth in a series about transgenerational inheritance, epigenetics, and glyphosate that address questions raised by the publication of the paper, Assessment of Glyphosate Induced Epigenetic Transgenerational Inheritance of Pathologies and Sperm Epimutations: Generational Toxicology.

The problem of founder effects

In this paper, the authors report the existence of a founder effect. A founder effect is a reduction in genetic diversity caused by a new population being established by a small number of “founders”. Breeding experiments that use an outbred strain (like the paper under discussion) are more likely to suffer from founder effects. In fact, the authors do report a founder effect.

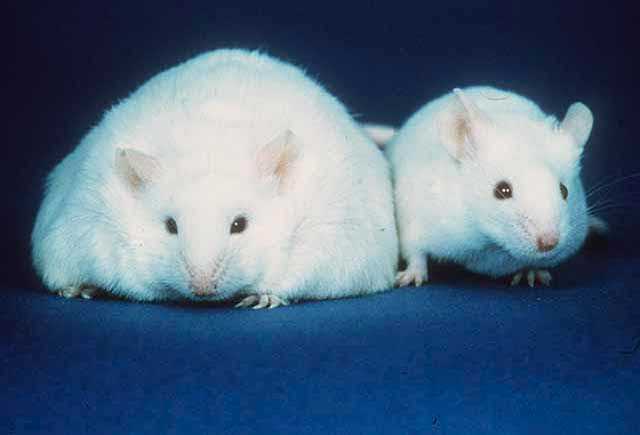
As a control in this experiment, the authors used a PBS (phosphate buffered saline) vehicle control since glyphosate was dissolved in PBS. The authors identified a founder effect in the control lineage derived from one female and one male. The F2 offspring of these mice were almost all obese. They removed all individuals derived from these animals. Removing these animals was appropriate. However, it raises some additional concerns about the genetics of these animals. Given then obesity is one of the key endpoints of the study, it seems possible that there may be additional, milder founder effects at play in other lineages (again, because they used an outbred strain).

obese mouse founder effect
Obese mice image from the Human Genome Project via Wikimedia.

After removing these animals from the study, there weren’t enough rats left in the control group, so the researchers replaced them with control animals from a concurrently running study. This is not necessarily a problem except that their control group was different. These new control animals were treated with dimethyl sulfoxide (DMSO) vehicle, not a PBS vehicle. In the pathology analysis, they verified that these two groups were not statistically different.

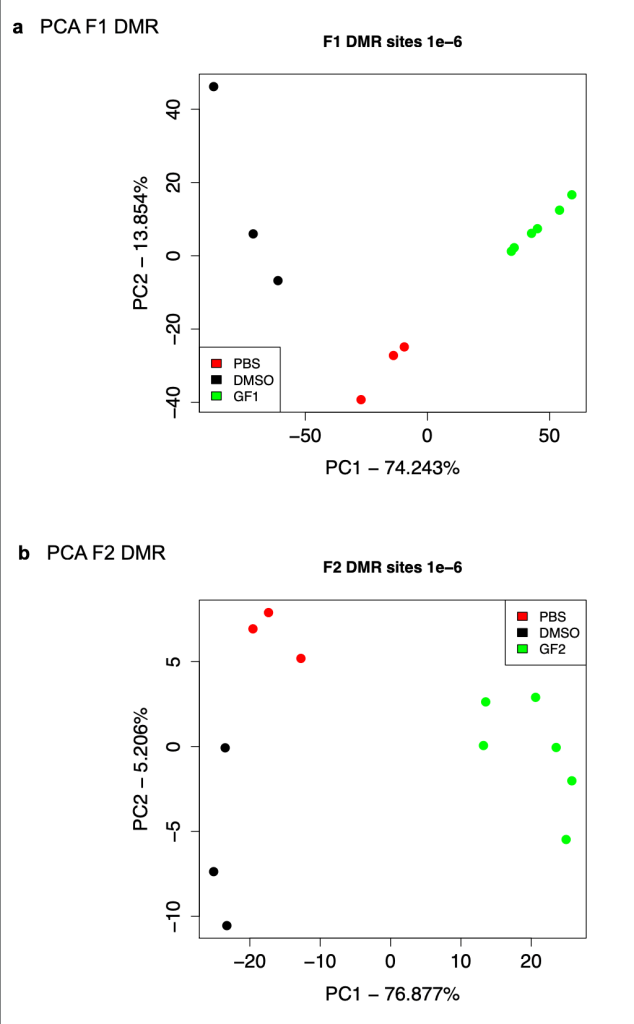
However, there is something odd in the principal component analysis (PCA) of the methylation data in the supplement that raises questions about whether DMSO and PBS treated animals can be considered equivalent and used interchangeably, particularly for the methylation analysis. In simple terms, a PCA is a way to group large datasets and visualize where the data groups in either two or three dimensions. How similar different treatments are is visualized by how far apart they are on the chart.

If you look at the DMR PCA analyses from the first and second generation, the DMSO and PBS controls do not cluster together. These PCA graphs show that the PBS controls and the DMSO controls weren’t similar until the F3 generation. Given that the major question of the paper is whether this is an example of transgenerational epigenetic inheritance, using controls that allow the authors to accurately use as a baseline of epigenetic marks at each generation is important.

With such a high degree of variation within the controls, a differential analysis becomes hard to interpret. Differences in F1 are less of a concern for reasons discussed in the next section, but the differences in F2 are a bigger concern since it is really the overlap between F2 to F3 patterns of methylation that are important for the question at hand. If there is not a consistent baseline in F2, identification of the differentially methylated regions for that generation will not be reliable.


View the other parts of our series on transgenerational epigenetic inheritance:

Part 3: Is the studied dose of glyphosate appropriate?

epigenetic ineheritance

By Alma Laney and Alison Bernstein

This post is the third in a series about transgenerational inheritance, epigenetics, and glyphosate that address questions raised by the publication of the paper, Assessment of Glyphosate Induced Epigenetic Transgenerational Inheritance of Pathologies and Sperm Epimutations: Generational Toxicology.

epigenetic ineheritance

Is the dose of glyphosate appropriate?

In any study on glyphosate, the dose must be comparable to actual exposure in order to provide useful results. For background on exposure, view SciMoms’ series on Risk vs Hazard.

The chosen dose was 25 mg/kg/day via intraperitoneal (i.p.) injection, which is an injection made through the peritoneum, which is a thin membrane lining the abdominal cavity. This exposure paradigm is different than dietary, inhalation or dermal exposure, which are the primary routes of potential human exposure, but agents administered via i.p. do go through the liver and this is a commonly used method. As with any experimental design choice, there are pros and cons to any delivery method. It is important to keep exposure route in mind when considering the results.

The authors write: “Twenty-five mg/kg for glyphosate is 0.4% of rat oral LD50 and 50% of the NOAEL and considering glyphosate rapid metabolism approximately twice the occupational exposure 3–5 mg/kg per daily exposure.”

LD50 is not relevant to this model of toxicity and only tell us about risk in cases where someone is exposed to a large amount of a chemical in a short amount of time. In other words, LD50s are relevant for accidents, murders or suicides. Reference dose (RfD) or Acceptable daily intake (ADI) is the relevant number when looking at chronic toxicity and is calculated from the No Observed Adverse Effect Level (NOAEL).

RfD (Reference Dose) or ADI (acceptable daily intake): an estimate of the daily exposure to humans that is likely to be without appreciable risk of deleterious effects throughout the entire lifetime.

In lay language, the reference dose is the amount a person could consume every day of their entire life and still be safe.

In the most current human health assessment from EPA, the NOAEL is 175 mg/kg/day and the RfD is 1 mg/kg/day. In the EU, EFSA based their RfD calculation on a NOAEL of 50 mg/kg/day and calculated an RfD (called ADI in the EU) of 0.5 mg/kg/day. The dose in this paper of 25 mg/kg/day is 25 times higher than the EPA RfD and 50 times higher than the EU ADI. This dose is 50% of the EFSA NOAEL and if the effect is real, this would suggest that the NOAEL is not actually a NOAEL. This is important if they are trying to do research to establish regulatory limits, but not relevant to understanding the effect of actual human exposures (see below for comparison to actual human exposure data).

Some may notice that the RfD in the new EPA draft human health assessment is higher than the old RfD for glyphosate of 0.1 mg/kg/day.  If we use the older, lower RfD, the chosen dose is even more irrelevant at 250 times the EPA RfD. The new higher limit is based on additional studies done since the previous registration for glyphosate and excludes the previous study that showed an adverse effect in the F3 generation. This exclusion explained in the new draft assessment  (See section 4.4.3 of the above-linked PDF for details).

In the three-generation study conducted in 1981 prior to the institution of the current Test Guidelines and Good Laboratory Practices, focal tubular dilation of the kidneys was observed in the offspring. This finding was judged to be spurious and unrelated to treatment since more extensive evaluations in subsequent reproduction studies conducted at much higher doses did not replicate the offspring effects.

For more detailed information about what “safety” means in a regulatory setting and what these metrics (LD50, NOAEL and Reference Dose) mean, read “Defining Safety: How Safe is Safe?” and “Glyphosate Vs. Caffeine: Acute and Chronic Toxicity Assessments Explained”.

Their quoted occupational exposure level is inconsistent with current data from the Agricultural Health Study. In the Farm Family Exposure Study data summary (part of the Agricultural Health Study), 60% of pesticide applicators in the study had detectable levels of glyphosate in their urine and the average urine level was 3.2 parts per billion (ppb). Average urine levels for spouses and children of applicators was less than 1 part per billion with only 4% and 12%, respectively, of each group having detectable exposures.

When exposure levels were estimated from these urine levels in this peer reviewed paper, it was found that the average exposure of 3.2 ppb for applicators corresponds to a dose of 0.001 mg/kg/day, or 0.1% of the newest EPA RfD and 0.2% of the EU ADI. Even the highest urine level of 223 ppb reported in the Farm Family Exposure Study corresponds to 0.004 mg/kg/day (0.4% of the EPA RfD) for the most highly exposed individual who didn’t take appropriate safety precautions. The dose in this paper of 25 mg/kg/day is 6,250 times higher than the highest measured exposure in the Farm Family Exposure Study and 25,000 times higher than the average measured exposure in this study.

Using even the highest estimates of exposures, pesticide applicators are exposed to levels of glyphosate that are a very small percentage of the safe limits. Consumers are exposed to much lower levels. Measures across other studies of agriculture and dietary exposures were consistent with these results. These estimates are far lower than the dose used in the paper and lower than their quoted estimate of 3-5 mg/kg daily exposure for occupational exposures.

Once we noticed these problems in their dose, we tracked their citations for this claim of a 3-5 mg/kg daily exposure and found citation errors (a problem that occurs at least one other time throughout the paper). Their citations for this exposure level are:

  1. A paper that looks at incidents of intentional self-poisoning that reports 4 cases of self-poisoning. In toxicological-speak, Intentional self-poisoning is acute dosing with very high doses (examples in the paper include: 85 g with 2-3 liters of beer, 18-35 g,1 Liter but no actual dose reported, and 72-91 g). Thus, this is an irrelevant citation for their occupational exposure number.
  2. An EFSA report that estimates various exposure scenarios as a % of AOEL (Acceptable operator exposure levels). Exposure levels here correspond to a daily dose of 0.1-0.66% of the ADI. If we take the highest dose (0.66% of ADI), this corresponds to 0.33 mg/kg/day. The dose used in this paper is 75 times higher than this highest estimated occupational exposure.

With this choice of dose and route, it is unclear what the authors are trying to model in this study. We can certainly do toxicology by increasing doses until we see an effect (this is important for finding limits and how high we can safely go), but this type of toxicology does not model what might be actually happening in people at relevant exposure levels. Thus the reporting of this paper as relevant to human exposures, even the highest of occupational exposures, is not justified.

Reference issues

Above, we mentioned that the citations supporting their claim of relevance to occupational exposure did not actually support that claim. While we did not examine the accuracy of every citation in the paper (there are 100 of them after all), the citations were incorrect in the only two places where we went to check citations.

The second place is the results with this sentence: “Direct exposure studies to glyphosate have been shown to induce behavioral abnormalities in the exposed F0 generation”. The authors then cite 4 papers that are not about glyphosate. These 4 papers include: a paper about vinclozoline, a review about transgenerational effects of endocrine disruptors that does not include the word glyphosate, a paper on atrazine in rats and a paper on atrazine in mice. These reference errors are sloppy at best but raise red flags and indicate that this paper requires closer scrutiny.


View the other parts of our series on transgenerational epigenetic inheritance:

Part 2: Guidelines for studying epigenetic inheritance

epigenetic ineheritance

By Alma Laney and Alison Bernstein

This post is the second in a series about transgenerational inheritance, epigenetics, and glyphosate that address questions raised by the publication of the paper, Assessment of Glyphosate Induced Epigenetic Transgenerational Inheritance of Pathologies and Sperm Epimutations: Generational Toxicology.

Guidelines for studying epigenetic inheritance

A 2017 paper mentioned, “A guide to designing germline-dependent epigenetic inheritance experiments in mammals”, provides guidelines for properly designing studies of germline epigenetic inheritance to control for the variables that we touched on in the above section. We will summarize the main points here and compare the recommendations to the design of the study under discussion.

Animal strain

Prior studies (including from the lab that published this glyphosate paper) suggest that outbred strains of animals are more sensitive to transgenerational impact of toxicant exposures and diet, and that different strains of mice show different susceptibility to these effects. Outbred mice are more similar to a human population than inbred mice. However, experiments with outbred strains become very difficult to interpret because every mouse is genetically different, undermining the purpose of these experiments to isolate a transgenerational epigenetic effect from a genetic effect.The guide to epigenetic inheritance experiments states: “unless there are clear reasons to choose an outbred strain, we recommend using inbred strains to remove genetic variability and aid the interpretation of epigenetic data.”

The glyphosate paper used an outbred strain, which provides a huge confounding effect to their results. The genetic differences they identified after 3 generations of breeding are not at all accounted for. In fact, their own data suggests that genetics plays a huge role (see section on founder effects) that is not adequately addressed.

The choice of an outbred strain for a transgenerational study creates many issues for interpretation of results. However, much has been said in online discussion about this paper about the specific choice of Sprague Dawley rats for this study so it is worth exploring if this is a concern. These rats are prone to spontaneous tumors, with most tumors occurring after one year of age. This 1992 paper explores rates of spontaneous neoplastic lesions of Sprague Dawley rats that were used as controls in 17 chronic toxicity/carcinogenicity studies from 1986-1992. Of 1340 male and 1329 female rats, ~15% of males and ~22% of females died or were sacrificed due to the presence of neoplasms by 2 years of age and none of these appeared until 15 months of age. The paper also characterizes non-cancerous health issues in these animals.

These age-related spontaneous tumors are a particular concern in any study where rats are aged. However, in this study, animals are euthanized at 12 months so it is not a major concern, but tumor incidence, location, and type should be tracked. Control animals would be the baseline comparison to look for an increase over the base rate of cancer incidence.

In the current paper, they lumped together all “disease,” despite what appears to be an in-depth pathological analysis. For example, in the testes they looked at markers of cancer and infertility but lumped them all into a binary classification of disease/no disease. In other tissues, the identified both cancer-related and non-cancer related pathologies, but also lumped these into the same binary classification scheme. It seems odd to reduce such an in-depth pathological analysis to a binary disease/no disease variable. Doing so skews the statistics in favor of obtaining a statistically significant result. The 1992 paper cited above that described the spontaneous neoplasms in aged Sprague Dawley rats provides a contrast for how the authors separated out various types of cancer by tissue. The choice to lump these all together makes interpretation of these results difficult, especially given the choice of strain.

Matrilineal vs patrilineal breeding

Because these studies span multiple generations of animals, well designed breeding schemes are critical and reporting of these breeding schemes in the manuscript is equally important. Because environmentally induced changes can be inherited from mother, father or both parents, it is important to control for these in an experiment.

For this reason, the authors of the review recommend not using a dual breeding group in which exposed males and exposed females are bred together.

Breeding designs that assess these options require exposing females and males of the parent generation to the environmental factor under study (e.g., experimental diet and control diet), then breeding the exposed females to control naive males (matriline) and exposed males to control naive females (patriline). A ‘dual breeding group’ in which exposed males are bred with exposed females can also be included to test for possible interacting effects that may be different than effects resulting from transmission through only one parent, but dual breeding should always be complemented by matrilineal and/or patrilineal breeding.

This is not what was done in the glyphosate paper. Males and females were exposed and crossbred at each generation without complimentary matrilineal or patrilineal breeding. The authors explain the breeding strategy in the results section.

No sibling or cousin breeding (crosses) was used in order to avoid any inbreeding artifacts in either the control or glyphosate lineages. Generally, 6–8 founder gestating females from different litters were bred, and 5 animals of each sex from each litter used to generate 25–50 individuals of each sex for each generation for analysis, as previously described.

This indicates that only a dual breeding strategy was employed at all generations, such that the lineages are now intertwined and not independent (which will be important for the discussion of statistics later). While this outbreeding does counteract the effects of using an outbred strain discussed above, it does create a different set of concerns.

With multi-generational studies such as this one, it is difficult to design a breeding strategy to keep these completely independent without needing to generate a very large number of animals. Thus, careful reporting and proper analysis become even more critical. This example of a well reported study allows the reader to understand and track each generation back to the original generation, explains that this was matrilineal and details how they chose mating pairs at each generation.

Duration of cohabitation during mating

As mentioned above transgenerational inheritance of traits can be mediated by epigenetic, ecological, or cultural mechanisms. In matrilineal experiments, it is critical to design experiments to allow the separation of germline effects from prenatal or postnatal variables that are known to have lifelong effects on offspring. Many researchers choose patrilineal breeding schemes since male rodents can be separated from the female after mating. However, if a treatment alters the health, appearance or behavior of males, this may affect females during mating and cause changes in offspring in ways independent of germline transmission.

There are multiple ways to deal with this and the considerations for each of these experimental design choices are discussed in detail in the aforementioned guide. However, even when choosing one of these proposed methods to control for these effects, it is still possible for males to impact females during cohabitation. Thus the only way to definitely rule out these other effects is to use assistive reproductive technology, a topic which is also discussed in the guide. The glyphosate paper provides no information regarding duration of cohabitation during mating.

Group size

One of the most important steps in experimental design is the determination of group size for statistical analysis. Group size is typically estimated prior to the start of an experiment based on the expected effect size, expected variability of the effect based on pilot studies or published data, and the expected distribution of data. Then, researchers work backwards to dose the appropriate number of animals in the parental generation. This paper does not indicate how many male and female animals were exposed in the parental generation. In addition, the group size varies between control and glyphosate and from generation to generation without any justification provided for why these sizes were set and why they are so different between.

A related consideration is to determine ahead of time the statistical test that will be done to ensure that the selected group size is adequate to detect a difference. Inadequate sample size planning can doom a study before it starts, creating ethical and resource issues. A sample size that is too small will miss real associations and find associations that don’t exist. This would be an ethical concern because an experiment that cannot possibly answer the question at hand is a waste of animals and inconsistent with the 3 Rs of animal research (Replacement, Reduction and Refinement). It is also a waste of time and resources. A sample size that is too large is also an ethical concern due to the unnecessary use of animals that aren’t needed to answer the questions at hand and uses unnecessary resources.

Selecting animals for breeding

This is a critical point that often goes unmentioned in methods and this study is no exception. From each litter, at each generation, there is a range of phenotypes observed in almost every experiment. Thus, researchers are faced with a choice of which animals from each litter to choose for various analyses and for breeding the next generation. There are multiple options available. If tests can be done prior to sacrifice, animals can be tested prior to breeding to help choose breeders, animals can be tested after breeding, or different animals can be used for analysis and breeding. Tests that are done after sacrifice can be done after breeding to acquire data on the animals that contribute to the lineage or separate animals can be used for analysis and breeding. Another possibility is to assign animals at random for breeding and other endpoints. Each of these scenarios has pros and cons. These issues is discussed in detail in the guide.

It is unclear from the methods how the authors selected animals for behavior tests, postmortem analysis, sperm collection and further breeding. The additional variation and founder effects introduced by choosing an outbred strain makes the need for appropriate choices here even greater. Again, this lack of detail in the methods combined with the choice to use an outbred strain and the observed founder effects, makes it very difficult to interpret the reported results. At a minimum, these decisions need to be reported.

Avoiding litter and cage effects

It is a well-known phenomenon that animals from the same cage or litter are more similar on behavioral and molecular measures than animals from different cages or litters. Studies must be carefully designed in regards to weaning strategies and these choices must be reported. Weaning is when pups are separated from the mother, split by gender and assigned to new cages. The main decision to make at the time of weaning is whether same-sex siblings of a given litter should be housed together or cross-fostered with same-sex animals from other litters.

An important recommendation in the guide to preventing litter effect is to keep the number of animals per cage constant, or at least within a narrow range, within and between experimental groups, especially for behavioral tests where the number of animals per cage is known to impact behavior. There are multiple strategies available (culling or cross-fostering, for example, summarized in the guide) and researchers must make choices about how to design their experiment to best control for these issues. If it is not possible to choose animals from independent litter, litter must be included in the statistical model.

As with many of the other experimental design options discussed, each choice has advantages and disadvantages. This underscores the need for reporting the weaning strategy in the methods section. There is also a known effect of number of pups during gestation on a variety of phenotypes. Some studies get around this by only using litters of a given size for subsequent stages. No information regarding weaning strategies or litter size is provided in the glyphosate paper.

Defining the experimental unit

This is related to both avoiding litter and cage effects, establishing group size and choosing the appropriate statistical test. As described in the guide, the experimental unit is the entity within an experiment that is assigned to a group and is the unit of statistical analysis. For a patrilineal breeding scheme, each individual male mouse is an experimental unit. For a matrilineal breeding scheme, the exposed female mouse is the experimental unit. All pups from a litter are technically part of the same experimental unit and are considered as one sample.

This also highlights some of the experimental design issues with a dual breeding schemes that we discussed earlier. Littermates cannot be considered as independent measures. Failure to appropriately consider that mothers are the experiment unit and using individual pups as the experimental unit causes inflated false positive rate (Type I errors). This applies at each generation, which largely drives the need for very large numbers of animals for transgenerational studies. The authors of the transgenerational methods guide recommend the following:

This issue needs to be addressed during experimental planning by using power analyses to estimate the number of litters required for the experiment, counting the number of litters in each generation as the experimental unit. Then, animals of different litters can be assigned to different behavioral or molecular tests and for breeding. Alternatively, multiple animals from the same litter can be tested, but their scores should either be averaged and considered as a single sample, or researchers can employ a mixed-effects model of analysis, which ensures that animals are nested within litters.

Very little information is provided in the methods of the glyphosate paper regarding these issues. There is no information provided about litter mates; the inconsistent number of animals used per group suggests that some of these animals were actually littermates. Relying on the numbers as reported and the data provided in the supplement raises major concerns about whether the researchers properly defined the experimental unit, adequately planned group sizes or controlled from litter and cage effects.

In conclusion, the study design as described is inadequate to answer the question of whether glyphosate exposure induces transgenerational epigenetic inheritance in the F3 generation. To give the authors the benefit of the doubt, this may be a problem of reporting and the study design may be adequate. Even going back to previous papers from this lab looking at transgenerational epigenetic inheritance with other toxicants did not add clarity on many of these issues. Many of these studies suffer from some or all of these same issues.

This lab has developed their system and are using their system to test a variety of different compounds. There is nothing necessarily wrong with this “plug and play” approach, if the methods utilized are appropriate and the system has been demonstrated to work to answer the questions at hand. Given the possible methodological problems here and in other papers, this “plug and play” approach does not seem appropriate here. They appear to be using the same design over the course of years without critically assessing if this design works as the field learns and progresses.

The purpose of a scientific paper is to provide adequate information to the reader to understand and interpret the results. Because of the poorly reported methodology, the paper as written raises so many questions that the results of this study are largely uninterpretable. Even if there were nothing wrong with the data collection or statistics, it would be extremely difficult to draw any conclusions from the information provided because of the methodology questions. The methods, as reported, are inadequate to determine if transgenerational epigenetic inheritance is occuring.

Given these experimental design problems, we could potentially dismiss this paper without getting into the details. However, it is a useful exercise to explore the other issues that further complicate and confound the reported results, even if we assume that all of these issues with methods can be explained by poor reporting and that the study design is actually ok.


View the other parts of our series on transgenerational epigenetic inheritance:
Part 1: What is Transgenerational Epigenetic Inheritance?

epigenetic ineheritance

By Alma Laney and Alison Bernstein

This post is the first in a series about transgenerational inheritance, epigenetics, and glyphosate that address questions raised by the publication of the paper, Assessment of Glyphosate Induced Epigenetic Transgenerational Inheritance of Pathologies and Sperm Epimutations: Generational Toxicology.

What is transgenerational inheritance?

Transgenerational inheritance is the concept that traits can be passed on from parent to great-grandchildren. In the context of toxicology, this hypothesis can be described as “ancestral environmental exposures to non-mutagenic agents can exert effects in unexposed descendants.” If you imagine a person being exposed to some substance, their reproductive cells are exposed so their children are also exposed (intergenerational inheritance). If that person is a pregnant female, the reproductive cells of their offspring are exposed so the grandchildren are also exposed (multigenerational inheritance). Thus, true transgenerational inheritance can only be observed in the great-grandchildren’s generation (transgenerational inheritance).


This graphic was originally published in a post on transgenerational exposure in the context of trauma and the Holocaust here.

What is transgenerational epigenetic inheritance?

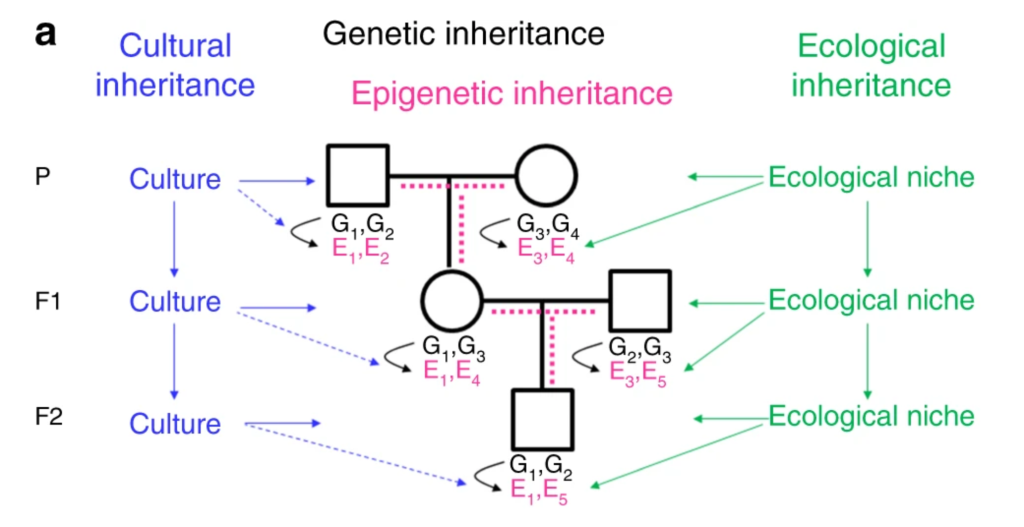
Transgenerational inheritance can occur through epigenetic, ecological, or cultural mechanisms (See Figure 1 of the linked paper below).

Transgenerational inheritance systems. a Offspring inherit from their parents genes (black), the environment (green) and culture (blue). Genes and the environment affect the epigenome (magenta) and the phenotype22. Culture also affects the phenotype, but at present there is no evidence for a direct effect of culture on the epigenome (broken blue lines). It is a matter of debate, how much epigenetic information is inherited through the germline (broken magenta lines). G genetic variant, E epigenetic variant.

Epigenetic inheritance

The focus of the paper under discussion is the epigenetic mechanisms through the germline, or transgenerational epigenetic inheritance. In any experiment of transgenerational inheritance, it is critical to use a careful study design to separate the epigenetic piece from the other mechanisms.

Epigenetics can be defined as: “the processes and marks on or around the DNA processes that control the activity of the genome and can be mitotically and/or meiotically inherited.” It encompasses a set of mechanisms that regulate gene expression and that can be inherited from cell to cell within an organism. Sometimes, if they occur in germline cells, these mechanisms may also be inherited from parent to offspring. Epigenetic mechanisms can also be sensitive to environmental inputs. Because they can be modified by the environment and may be inherited from parent to offspring, epigenetic mechanisms are a prime candidate for mediating transgenerational inheritance.

Epigenetics generally refers to four mechanisms.

  1. Cytosine modifications: These are direct covalent modifications of cytosines in the DNA sequences, including DNA methylation, which is measured in the paper under discussion.
  2. Histone modifications: Histones are proteins that, with DNA, form chromatin and make up chromosomes. Each histone has a tail that can be covalently modified.
  3. Non-coding RNAs: These functional RNAs that are not translated into protein and are involved in many cellular processes, including regulation of the epigenome.
  4. Long range chromatin interactions: This refers to the 3D arrangement of DNA and chromosomes within cells. In addition to the packing of DNA into chromosomes by histones, chromosomes interact with themselves and with other chromosomes to form functional domains.

These four mechanisms do not exist in isolation. They form a network of interacting mechanisms that all work together to affect gene expression. For an overview on these mechanisms of epigenetics, please visit the “Intro to Epigenetics” series at Mommy, PhD.

Transgenerational epigenetic inheritance is well documented in plants and the commonly used model organisms, such as C. elegans (roundworms) and D. melanogaster (fruit flies). However, whether transgenerational inheritance occurs in mammals is still unclear.

Does transgenerational epigenetic inheritance occur in humans?

The existence of transgenerational epigenetic inheritance remains unclear in mammals. There are a few reasons why this is hard to answer.

First, humans are complicated. When we have evidence of transgenerational inheritance of a trait in people, it is nearly impossible to separate the cultural and ecological effects from the epigenetic effects to definitively say if that inheritance occurs partly or exclusively through a biological mechanism. In humans, exposures are rarely isolated to the original generation only, making it extremely difficult to separate out true transgenerational effections. In addition, even when exposures are isolated, those exposures often produce differences that have their own effects. In the example of the Holocaust, it is difficult to separate the effects of trauma from living through the Holocaust on offspring from the effect of having a parent who lived through the Holocaust on offspring.

In order to determine if transgenerational inheritance occurs, scientists must stop the exposure in the original generation to isolate the exposure. While this can be done in model organisms in the lab, exposures are rarely isolated to a single generation in humans. Even when they are, the genetic, ecological and cultural confounders are so complex that it is extraordinarily difficult to conclusively identify transgenerational epigenetic inheritance in humans.

Second, experimental design is extremely complicated. We can use model organisms (such as mice or rats) to control for some of these factors to determine if transgenerational epigenetic inheritance occurs in mammals. However, when properly designed, these experiments are extremely complicated, expensive, and time-consuming, as described in A guide to designing germline-dependent epigenetic inheritance experiments in mammals. These experiments can be done, but at this point in time, very few studies are properly designed to actually be able to answer this question. We will discuss this in more detail below when we get to the methods of the paper under discussion.

Third, germline reprogramming clears (erases) many epigenetic marks twice during mammalian development. First, DNA methylation marks are cleared during germ-cell development. There is a second wave of demethylation following fertilization; the timing of this demethylation and the reestablishment of methylation patterns is different for maternal and paternal chromosomes. A subset of genes (mostly imprinted genes) do not undergo this second wave of demethylation and are more sensitive to environmental regulation. Thus, only a subset of the genome could be undergoing translational epigenetic inheritance. While research in the area is still evolving, it is clear that more of the genome than previously thought is protected from this second wave of demethylation. But transgenerational epigenetic inheritance seems unlikely to be a genome-wide phenomenon.

State of the transgenerational inheritance science

This 2018 state of the science report on transgenerational inheritance from the National Toxicology Program cites 21 papers from the lab that published the current glyphosate study. It summarizes the weaknesses of the existing evidence and underscores the need for well-designed studies.

“In conclusion, a broad range of exposures and outcomes have been reported to support transgenerational inheritance of health effects. Over 80 different agents have been tested in a transgenerational experimental design; and this state of the science review collected and categorized the literature into a systematic evidence map for transgenerational inheritance by broad health effect categories, exposures, and evidence streams. This scoping review and evidence map identifies serious limitations in the available bodies of evidence to support a systematic review for reaching hazard conclusions or even rating certainty in the bodies of evidence under evidence to decision frameworks such as the Grading of Recommendations Assessment, Development and Evaluation (GRADE) approach.”

This report includes assessments of potential bias in the studies that do exist. The images below show a summary of their assessment of bias in animals studies (top) and specifically in animal studies of vinclozolin (bottom). The top panel shows that the probability of bias is “probably high” for many papers on many measures, with more than half of papers showing a “definitely high” risk of bias for confidence in the exposure characterization. The bottom panel shows the risk of bias from individual studies.

Risk of bias summary and heatmaps of vinclozolin and radiation animal transgenerational studies. A) Risk of bias bar chart presenting the summary percent ratings for each risk of bias question for the example of animal transgenerational studies. The vinclozolin and radiation exposure studies were used as examples to illustrate internal validity or risk of bias issues for studies of transgenerational design because these exposures were the largest bodies of evidence. B) The risk of bias heatmap of the individual studies of animal vinclozolin exposure.

You can see from these images that much of the risk of bias seems to arise from the failure to report specific aspects of the methods and results. Nine of the fifteen papers listed in this panel are from the lab that performed the study in question. The areas identified as being of high risk for bias are also problematic in the current study as we will go through in detail below. This doesn’t necessarily mean that the studies are flawed or the results are biased, but it does mean that the results cannot be accurately interpreted and it is not possible to determine if they are flawed or valid.


View the other parts of our series on transgenerational epigenetic inheritance:
Alma Laney joins BFI Board

Biofortified Board note: We are pleased to welcome Alma Laney to the BFI Board! Thanks to Alma for sharing this introduction and we look forward to working with you!

Hi! I’m Alma Laney. You may know me as The Mad Virologist. I’m thrilled to join the Biology Fortified team and to continue teaching others about science. As the newest board member, I’m excited to tell you about my background in research and outreach. Some of you may already be familiar with my work. I’m passionate about teaching science and I’ll bring that same passion to Biology Fortified.

My research background

Mad Virologist Alma Laney BFI
Collecting winter wheat samples in the spring of 2016. Image by Alma Laney.

My background includes microbiology, plant pathology, plant science, molecular biology, entomology and virology. By training I am a plant virologist specializing in viruses transmitted by arthropod vectors (also known as arboviruses).

I’ve worked with many different viruses, including rose rosette virus, soybean mosaic virus, fig badnavirus-1, and several species of barley yellow dwarf virus. Since I haven’t worked with a single system, my research has focused on using applied and basic biology techniques to address viruses of ornamentals and crops to identify new viruses and develop control methods.

My current project focuses on the interactions between two species of barley yellow dwarf virus, PAS and PAV, and the cereal aphid vector, Rhopalosiphum padi also known as the bird cherry-oat aphid. Part of the research project is to biologically characterize the unique variants of PAS and PAV that my lab found in Kansas. We will also begin functionally characterizing the different viral genes using infectious clones that I am developing.

My work is funded by a USDA NIFA Education and Workforce Development Program Postdoctoral Fellowship grant. I wrote this grant with my advisor, and it was awarded. Our work began in Kansas, but the lab moved to North Carolina and our work has continued there.

Why I started “The Mad Virologist”

I started The Mad Virologist Facebook page on June 19th, 2015 due to attitudes I saw online towards scientists and science in general. Shortly before I started my page, tragedy struck my field. The West African Ebola outbreak claimed the lives of many people, including health care professionals and virologists. One of those who died was Dr. Sheik Humarr Khan. He was a world expert on viral hemorrhagic fevers, especially Lassa fever. Yet he still contracted Ebola and passed away from it.

Around this time, the March Against Monsanto movement was gaining strength. Scientists were regularly accused of not caring about people and being paid by big business. As several scientists had just given all to help others, this didn’t sit well with me. I started my page, and later my blog, to discuss how this idea that scientists don’t care about others doesn’t make sense, given how much scientists sacrifice to help others. I wanted to use my page to educate the public. I also wanted to show why attacks on scientists are not fair or reflective of how scientists actually are.

Scicomm isn’t easy, but it’s worth it

When I started my page, I didn’t understand why there aren’t more scientists doing outreach. I quickly found out that there is a cost to being outspoken on social media. I run the page in my spare time when I’m not working or spending time with my family. It’s hard work to develop new content, such as blog posts or infographics, and to keep finding relevant news to share. Often, I have to spend extra time on my career rather than on my outreach.

I have had people go out of their way to attack me, threaten me with legal action, and try to get me in trouble at work. But it hasn’t been all bad. I’ve made many friends, including several that I am very close to. I’ve been able to make a positive impact on people’s lives. Despite all of the issues I’ve had, I don’t regret sharing science on social media. I’m passionate about teaching others science, and social media allows me to share science with people all over the world.

Working with Biology Fortified

So how will I help Biology Fortified as a board member? I’ve followed Biology Fortified since I was in grad school, roughly 10 years. In that time, it has become a valued resource for many. There are a wealth of blog posts and infographics to teach people about biotechnology, pesticides, regulations, and many other issues in food and agriculture. Recently in 2017, I collaborated with Biology Fortified and Dr. Layla Katiraee in developing an infographic with an accompanying blog post to explain how transgenic virus-derived resistance works in plants.

As a board member, I will continue to add to the wealth of knowledge on this website. I’ll start by introducing several blog posts that I have been working on. I won’t give away what those posts are, but be on the lookout for them. I’m excited to be part of the team at Biology Fortified! I look forward to helping the organization continue to fulfill its mission in the years to come.

The sun rises on another great day at Biology Fortified!

How virus resistance works in GMOs

Written by Alma Laney

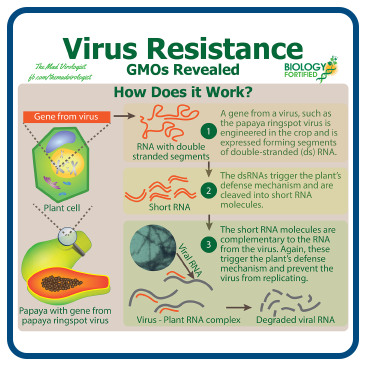
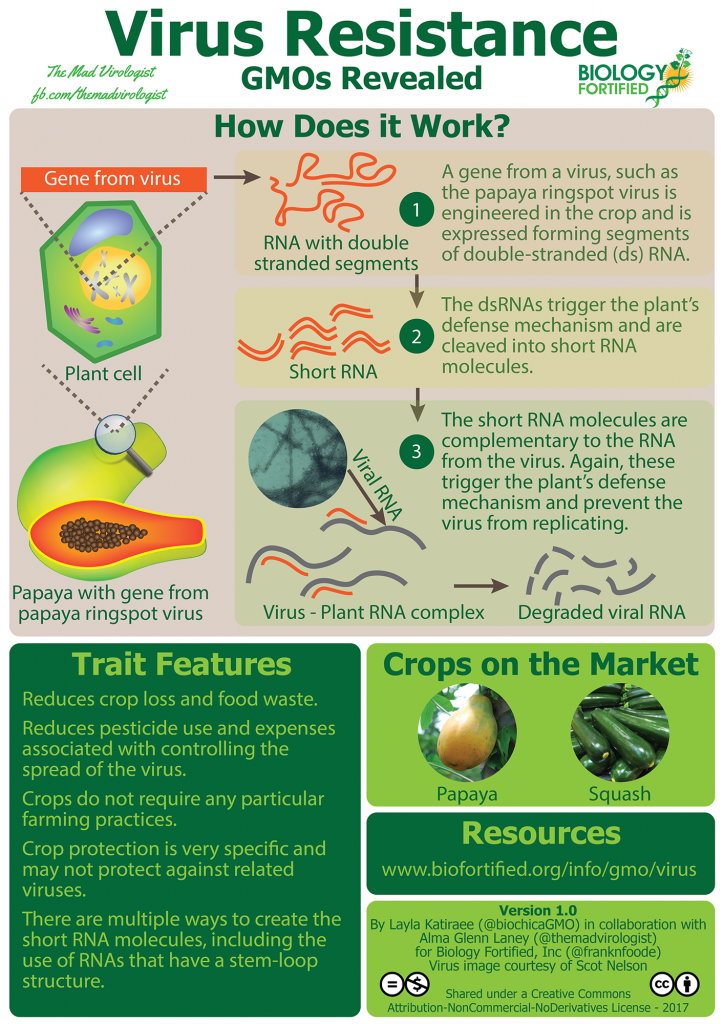
GMOs Revealed Virus Resistance Infographic
Visit the infographic page for a larger version.

I’m Alma Laney from The Mad Virologist, and I work with plant viruses and the insects that help them spread. I’m happy to announce that Biology Fortified just published a new infographic that I helped develop with Layla Katiraee and the rest of the team here at Biology Fortified to help explain how virus resistance is created in genetically engineered crops.

The GMOs Revealed infographic on Virus Resistance distills a lot of information about how to engineer this trait into plants, with papayas and squash as the current examples on the market. There is really a lot more to this issue than these two examples, so I wanted to give a detailed overview explaining the challenges that farmers face with viral plant diseases, methods of control, and approaches to engineering resistance. Go to the infographic page for the short version, but if that’s not enough to ‘inoculate’ your curious mind, read on!

Introduction

Plant viruses can be serious pathogens in crops as they can cause anywhere from minor losses to a total loss. Viruses can infect crops in a number of ways ranging from being transmitted by contaminated tools, seed and pollen infections, infection of tubers or other vegetatively propagated material, and by arthropod vectors1 (what mites and insects are collectively known as). Most plant viruses are transmitted to crops via arthropod vectors. Plant viruses are of concern to farmers because once they get into a crop, all you can do is try and prevent their spread. Because of this, control strategies focus on preventing the introduction and spread of these viruses.

Control of plant viruses

There are several strategies that farmers use to prevent and control viral infections:

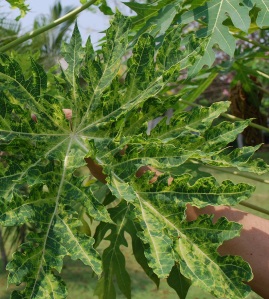
Papaya leaf infected with PRSV, Thailand. Credit KJHvM
  • Use certified seed or plants, which have been tested for known pathogens. Lots containing pathogens are rejected by the company.
  • Control weeds around the fields as weeds can harbor both viruses and their vectors, serving as a source of inoculum for the field.
  • Limit the spread of soil and the use of dirty implements. Some plant viruses can be carried by infested soil and contaminated implements can transfer the virus to healthy plants. There are many disinfectants that can be used including dilute bleach and milk solutions.
  • Use seed treatments and/or spraying insecticides on the crop. Since most plant viruses are transmitted by arthropod vectors, this can be an effective strategy but it does not work in cases where the viruses are transmitted quickly (in non-persistent or semi-persistent transmission; see Table 1).
  • A control strategy that isn’t always effective is to use a mild strain of a virus that is inoculated onto a plant. The mild strain can induce resistance to more severe strains, but this is problematic as mixed infections with other viruses can cause severe disease, the mild strain could become more severe, the mild strain would still cause economic losses, or the mild strain just may not work. This strategy is called cross protection.
  • Once a virus  is in a field, farmers can take action by roguing symptomatic plants (removal of infected plants followed by destroying them). This can be a costly measure and is used in cases where the type of virus can be transmitted quickly.

Table 1: The types of virus transmission2 detailing how long it takes to acquire a virus, how long it takes before the virus can be transmitted, and an example of each.

Transmission typeVirus acquisitionVirus transmissionExample
Non-persistentAs little as a few secondsA few minutesPapaya ringspot potyvirus
Semi-persistentSeveral minutesMinutes to hoursCauliflower mosaic caulimovirus
Circulative, non-propagativeMinutes to hoursHours to daysBarley yellow dwarf luteovirus-PAV
Circulative, propagativeMinutes to hoursUp to a few weeksTomato spotted wilt tospovirus

However, one of the best strategies is to engineer resistance to plant viruses. There are several examples of plant virus resistance genes that can be found in the germplasm (a collection of seed and/or plant tissue reflecting a variety of genotypes). However, for some crops, there are no known resistance genes or if they exist, they are found in wild relatives and attempts to introgress (move a trait into a crop plant by conventional breeding) the genes have not been successful. This is where genetic engineering can provide a solution. Genetically engineered plant virus resistance induces two different forms of resistance and one of the methods can use two different approaches.

Transgenic approach to virus control

Early on, virologists transformed plants with the complete virus coat protein gene, which forms the shell of the virus to protect the genetic material. It was found in the case of Tobacco mosaic tobamovirus (TMV), that over-expression of the coat protein gene led to virus resistance because the excess coat protein interfered with the ability of the virus to complete its lifecycle and move systemically in the plant3. Based on this, transgenics for other viruses were generated including Papaya ringspot potyvirus (PRSV), Cucumber mosaic cucumovirus (CMV), Zucchini yellow mosaic potyvirus (ZYMV), and Watermelon mosaic potyvirus (WMV). However, later research uncovered a second way that transgenics can induce resistance to plant viruses: triggering the RNA silencing (RNAi) pathway found in plants.

The discovery of RNAi was revolutionary. It has led to other control strategies as well as providing a powerful tool for functional analysis of genes. In plants, the RNAi pathway serves as a type of immune system for plants to target pathogens4, including viruses. There are multiple ways that the RNAi pathway can be triggered:

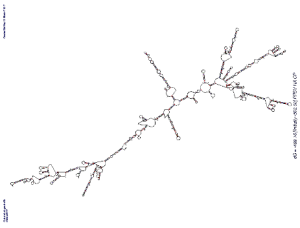
Predicted folding structure of the coat protein gene for a Hawaiian isolate of Papaya ringspot potyvirus (GenBank Accession # S46722.1) generated by A.G. Laney using mFold. Note, this is only one of many predicted folding structures for this gene and is used to illustrate that there are double stranded regions of the gene that could trigger the RNAi pathway.
  • dsRNA: Most of the described plant viruses have RNA genomes and one of the byproducts of viral replication is double-stranded RNA (dsRNA)5. This dsRNA is very stable and triggers the RNAi pathway. However, even with DNA viruses, some of the genes overlap and can trigger the RNAi pathway too6. With the transgenics that utilized the complete coat protein but triggered the RNAi pathway, it was found that in some cases the secondary structure of the RNA produced regions with dsRNA that could trigger RNA silencing in plants (see image at right)7.
  • Short hairpins: The discovery that short dsRNA segments could trigger RNAi led to the use of constructs that generate a hairpin cassette that forms into dsRNA8. Early uses of virus-derived transgenic resistance used entire genes; however, with advances in our understanding of the RNAi pathway, many researchers have adopted the hairpin cassette method as it allows for the targeting of multiple viruses and/or viral genes9. This has several benefits. By targeting multiple genes, researchers are able to minimize the chances of the targeted virus developing resistance to the transgenic plant. The hairpin cassette technique also allows researchers to target multiple viruses with a single construct.

Virus-derived transgenic products on the market

Virus Resistant Papaya, credit: KJHvM

The most widely known transgenic on the market is papaya that is resistant to PRSV10. This product actually saved the papaya industry in Hawaii as PRSV makes fruit unmarketable and eventually kills infected trees. Complicating matters, PRSV is transmitted by several aphids non-persistently (it’s carried in the stylet of the aphid) so it transmits as soon as the aphid probes the plant tissue. Because of this, attempts to control the aphid vectors by spraying does not work as the virus has already been transmitted by the time the aphids are killed.

Resistance to the virus was the only option; however, although resistance to PRSV has been identified in wild relatives, all attempts to introgress the trait were have not been successful introduced into cultivated papaya from a wild relative until just recently11 after 50 years of attempts by plant breeders. The only strategy that papaya growers could use was moving their operations to another island. Each time they moved, there was a short reprieve, but the virus eventually made it to that area. To combat this, work was started to investigate the potential for cross protection; however, it was not effective with the isolates found in Hawaii. Luckily at around that time, news of a new technique was announced that used a transgenic with the coat protein of a virus that provided resistance to that virus. So work on a transgenic began. By the time PRSV made it to the last papaya growing area in Puna, Hawaii, the transgenic was ready and the industry was saved.

Virus Resistant Squash, credit: Stephan Neidenbach

There are two different transgenic events for virus resistance in summer squash. The first, ZW-2012, targets ZYMV and WMV whereas the second, CZW-313, targets CMV in addition to ZYMV and WMV. ZYMV and WMV are related to PRSV (they are all in the same genus, Potyvirus) and are targeted by introduction of the entire coat protein gene that induces the RNAi pathway in plants. The way that the CMV construct works is interesting. It seems that the introduction of the coat protein gene acts by interfering with the life cycle of the virus and by inducing the RNAi pathway.

Virus-derived transgenic products in development

There are a number of transgenic crops that utilize virus-derived resistance currently in development. These range from rice plants engineered to resist Rice grassy stunt tenuivirus14 to cotton plants that are resistant to Cotton leaf curl Kokhran begomovirus15  to tomatoes resistant to Tomato yellow leaf curl begomovirus16 to lettuce that is resistant to Mirafiori lettuce big-vein ophiovirus17. (See here for an article on Biofortified about virus-resistant black beans in Brazil.) Each of these viruses causes severe losses in their respective crops and durable resistance either has not been found or has been hard to introduce into the respective crop plants. This is just a small subset of the virus-derived transgenic plants that are in various stages of development worldwide. However, there are several viral diseases that cause food insecurity and/or severe economic losses that have transgenic solutions. Two that are threats to food security will be discussed below:

Cassava mosaic disease (CMD)

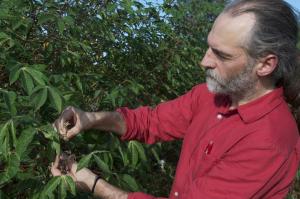
VIRCA Plus director Dr. Nigel Taylor working with Cassava. Credit: Donald Danforth Plant Science Center

This disease  contributes to food insecurity in Africa and Southern Asia18  and is caused by at least 10 related virus species in the genus Begomovirus. Losses to CMD are due to the absence of tubers on infected plants. Since cassava grows well in poor soil with less rain than other staple crops, it is widely grown in sub-Saharan Africa. Because of the severity of the losses and because cassava is often a crop counted on to help reduce the effects of famine, it is an ideal target for virus-derived transgenic resistance.

By targeting a gene that is essential for begomovirus replication (AC1), researchers were able to generate cassava plants that were resistant19 to African cassava mosaic begomovirus as well as two related cassava begomoviruses. This was then improved further by targeting two additional genes essential for begomovirus replication (AC2 and AC3)20. The effort to develop virus-derived transgenic resistance to CMD has been included in the VIRCA Plus project which combines resistance to CMD, cassava brown streak disease and nutritional improvements (transgenic fortification with zinc and iron)  with to cassava.

Cassava brown streak disease (CBSD)

Like CMD, CBSD is a threat to food security. Although CBSD can reduce tuber size it does not result in no tubers as with CMD. However, what remains of CBSD symptomatic tubers are inedible due to necrosis in the tubers making infected crops a near total loss21. CBSD is caused by viruses that are transmitted by whiteflies. However, there are only two known species, Cassava brown streak ipomovirus and Ugandan cassava brown streak ipomovirus, and both are generally just referred to as CBSV. Like CMD, the viruses that cause CSBD have been targeted using virus-derived transgenic resistance22 and as mentioned above, transgenic resistance to these viruses have been included in the VIRCA Plus project.

Other avenues for using RNA silencing

The usefulness of RNA silencing is not limited to resistance to plant viruses. There have been other examples of this technology being used to prevent browning due to oxidation (Arctic apple and the Simplot Innate potatoes – see articles on Biofortified about the apple and potato) and reducing acrylamide formation in cooked potatoes (also the Innate potato). Another area being explored that relates to transgenic virus resistance is the development of RNA silencing for arthropod vectors of plant viruses. This is still in the early stages of development, but shows great promise in offering more options for farmers to use in integrated pest management. As with virus-derived resistance, RNA silencing for insect control has focused on turning off genes that are essential for the insect to live, such as v-ATPase subunit A in whiteflies23, or genes that are essential for insect-plant interactions, such as C002 which is expressed in the salivary glands of aphids24. There will be an additional post discussing the use of RNA silencing for other uses in the near future.

Conclusions

Virus-derived transgenic resistance holds great promise in sparing growers and consumers the costs of losses due to virus infection. Furthermore, this technology has saved at least one crop, papaya grown in Hawaii, and holds the potential to grant those in developing nations food security by preventing losses in staple crops. Some of the other benefits of this approach to controlling plant viruses is that it reduces sprays that were used to control the arthropod vectors, while not altering how the crops are grown. One of the main challenges is that resistance to one strain of virus may not give strong resistance to other strains, so the evolution of new virus strains must be closely monitored.

References:

  1. Leitner et al., 2015. Arthropod Vectors and Disease Transmission: Translational Aspects. PLoS Neglected Tropical Pathogens 9(11):  e0004107. DOI: 10.1371/journal.pntd.0004107
  2. Whitfield et al., 2015. Insect vector-mediated transmission of plant viruses. Virology Volumes 479–480: 278–289 DOI: 10.1016/j.virol.2015.03.026
  3. Beachy, 1999. Coat-protein-mediated resistance to tobacco mosaic virus: discovery mechanisms and exploitation. Philos Trans R Soc Lond B Biol Sci 354:659-664. DOI: 10.1098/rstb.1999.0418
  4. Obbard et al., 2009. The evolution of RNAi as a defence against viruses and transposable elements. Philos Trans R Soc Lond B Biol Sci 364(1513): 99–115. DOI: 10.1098/rstb.2008.0168
  5. Weber et al., 2006. Double-Stranded RNA Is Produced by Positive-Strand RNA Viruses and DNA Viruses but Not in Detectable Amounts by Negative-Strand RNA Viruses. Journal of Virology. 80(10): 5059–5064. DOI: 10.1128/JVI.80.10.5059-5064.2006
  6. Li et al., 2014. Suppression of RNA Silencing by a Plant DNA Virus Satellite Requires a Host Calmodulin-Like Protein to Repress RDR6 Expression. PLoS One. DOI: 10.1371/journal.ppat.1003921
  7. Lindbo and Falk, 2017. The Impact of “Coat Protein-Mediated Virus Resistance” in Applied Plant Pathology and Basic Research. Phytopathology 107(6): 624-634 DOI: 10.1094/PHYTO-12-16-0442-RVW
  8. Jia et al., 2007. A strategy for constructing and verifying short hairpin RNA expression vectors. J RNAi Gene Silencing 3(1): 248–253. PMCID: PMC2737214
  9. Lambeth et al., 2010. A direct comparison of strategies for combinatorial RNA interference. BMC Molecular Biology 11:77. DOI: 10.1186/1471-2199-11-77
  10. Gonsalves et al., 2004. Transgenic Virus Resistant Papaya: From Hope to Reality for Controlling Papaya Ringspot Virus in Hawaii. APSnet Features. Online. DOI: 10.1094/APSnetFeature-2004-0704
  11. Siar et al., 2011. Papaya ringspot virus resistance in Carica papaya via introgression from Vasconcellea quercifolia. Euphytica 181: 159-168 DOI: 10.1007/s10681-011-0388-z
  12. Fuchs and Gonsalves, 1995. Resistance of Transgenic Hybrid Squash ZW-20 Expressing the Coat Protein Genes of Zucchini Yellow Mosaic Virus and Watermelon Mosaic Virus 2 to Mixed Infections by Both Potyviruses. Nature Biotechnology 13: 1466 – 1473 DOI: 10.1038/nbt1295-1466
  13. Tricoll et al., 1995. Field Evaluation of Transgenic Squash Containing Single or Multiple Virus Coat Protein Gene Constructs for Resistance to Cucumber Mosaic Virus, Watermelon Mosaic Virus 2, and Zucchini Yellow Mosaic Virus. Nature Biotechnology 13: 1458 – 1465 DOI: 10.1038/nbt1295-1458
  14. Shimizu et al., 2013. Strong Resistance Against Rice grassy stunt virus Is Induced in Transgenic Rice Plants Expressing Double-Stranded RNA of the Viral Genes for Nucleocapsid or Movement Proteins as Targets for RNA Interference. Phytopathology 103: 513-519 DOI: 10.1094/PHYTO-07-12-0165-R
  15. Yasmeen et al., 2016. Amplicon-Based RNA Interference Targeting V2 Gene of Cotton Leaf Curl Kokhran Virus-Burewala Strain Can Provide Resistance in Transgenic Cotton Plants. Molecular Biotechnology 58: 807-820 DOI: 10.1007/s12033-016-9980-8
  16. Fuentes et al., 2016. Field Trial and Molecular Characterization of RNAi-Transgenic Tomato Plants That Exhibit Resistance to Tomato Yellow Leaf Curl Geminivirus. Molecular Plant-Microbe Interactions 29: 197-209 DOI: 10.1094/MPMI-08-15-0181-R
  17. Kawazu et al., 2016. Development of marker-free transgenic lettuce resistant to Mirafiori lettuce big-vein virus. Transgenic Research 25: 711-719 DOI: 10.1007/s11248-016-9956-2
  18. Alabi et al., 2011. Cassava Mosaic Disease: A Curse to Food Security in Sub-Saharan Africa. APSnet Features. Online. DOI: 10.1094/APSnetFeature-2011-0701
  19. Chellappan et al., 2004. Broad Spectrum Resistance to ssDNA Viruses Associated with Transgene-Induced Gene Silencing in Cassava. Plant Molecular Biology 56: 601-611 DOI: 10.1007/s11103-004-0147-9
  20. Zhang et al., 2005. Resistance to cassava mosaic disease in transgenic cassava expressing antisense RNAs targeting virus replication genes. Plant Biotechnology Journal 3: 385-397 DOI: 10.1111/j.1467-7652.2005.00132.x
  21. Patil et al., 2015. Cassava brown streak disease: a threat to food security in Africa. Journal of General Virology 96: 956-968 DOI: 10.1099/vir.0.000014
  22. Ogwok et al., 2012. Transgenic RNA interference (RNAi)-derived field resistance to cassava brown streak disease. Molecular Plant Pathology 13: 1019-1031 DOI: 10.1111/j.1364-3703.2012.00812.x
  23. Thakur et al., 2014. Enhanced Whitefly Resistance in Transgenic Tobacco Plants Expressing Double Stranded RNA of v-ATPase A Gene. PLoS One 9(3): e87235 DOI: 10.1371/journal.pone.0087235
  24. Pitino et al., 2011. Silencing of Aphid Genes by dsRNA Feeding from Plants. PLoS One 6(10): e25709 DOI: 10.1371/journal.pone.0025709

Written by Guest Expert

Alma Laney works with plant viruses and the arthropods who vector them and on his blog The Mad Virologist he covers all aspects of virology from human pathogens to archaea viruses and everything in between. http://themadvirologist.blogspot.com/